Global Markets Tumble Amid Rate Hike and Inflation Concerns
On Thursday, many Asian stock markets declined following Wall Street's negative performance. Traders remained cautious towards risk-driven assets due to concerns over slowing economic growth and increasing interest rates.
Similarly, the hawkish remarks made by Federal Reserve officials caused uncertainty in the markets regarding the central bank's plan to halt its rate hike cycle by June. Consequently, this led to a weak overnight closing on Wall Street.
Wednesday, Federal Reserve Bank of New York President John Williams stated that inflation is still a concern and that the central bank will take steps to reduce it. He also acknowledged that recent stress in the banking sector may have a negative impact on economic activity.
EURUSD
In March, Eurozone headline inflation was confirmed at 6.9% YoY, and the European Central Bank (ECB) officials continue to indicate the possibility of further rate hikes. ECB Chief Economist Philip Lane has stated that a rate hike in May is probable, and the size of the hike will be determined by the data. The upcoming S&P Global PMIs on Friday will provide new insights into economic activity. Isabel Schnabel noted that although inflation has started to decline, underlying inflation remains stubborn. The ECB will release the minutes of its latest meeting on Thursday, and the markets have fully priced in a 25 bps rate hike in May.
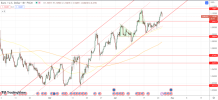
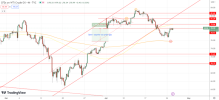
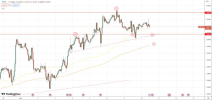
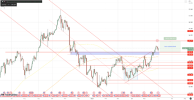
The EURUSD has maintained its adherence to the upper channel and is currently trading at the resistance level of 1.0980. If the price manages to break through this level, it may advance further towards the last resistance at 1.1075. However, if there is a sell-off, the pair may break the strong bullish trend channel and enter a new price action for a downturn. On the 4H chart, the 100 MA is likely to be the first support, followed by 1.0885.
The EURUSD has maintained its adherence to the upper channel and is currently trading at the resistance level of 1.0980. If the price manages to break through this level, it may advance further towards the last resistance at 1.1075. However, if there is a sell-off, the pair may break the strong bullish trend channel and enter a new price action for a downturn. On the 4H chart, the 100 MA is likely to be the first support, followed by 1.0885.
Support: 1.0920– 1.0885 – 1.0840
Resistance: 1.0965 – 1.1000 – 1.1045
GBPUSD
Despite the rally in U.K. government bond yields, which increased significantly and more than global counterparts after March's inflation data surpassed expectations, the British pound may not receive significant support from monetary policy. While double-digit inflation may prompt the Bank of England to raise rates again in May, further tightening could compromise the country's fundamentals and result in a stagnant economy, leading to a possible recession in the future.
According to futures markets, investors are currently pricing in a quarter-point interest rate hike to 4.25% at the Bank of England's next meeting on May 11. They also anticipate rates to reach a peak of 5% by September.
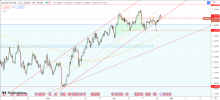
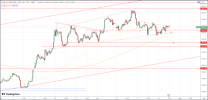
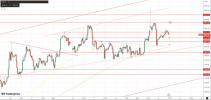
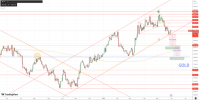
Technically, the formation of a Double Top pattern may lead to the formation of a Head and Shoulders pattern if a new consolidation happens next. However, the Bullish channel is still holding the price up after the lower parallel touch at 1.2350. The 1.2400 level could be a potential support that could hold the pair down or it could be the last point of support before a new selloff and a change in trend direction.
Support: 1.2440– 1.2400 – 1.2350 Resistance: 1.2470 – 1.2500 – 1.2550
USDJPY
The Japanese trade deficit unexpectedly contracted in March, as exports grew more than anticipated and imports increased at a slower pace. Reports also indicated that the Bank of Japan may consider tightening its ultra-loose monetary policy later this year if wage growth remains robust, although no policy changes are expected at next week's meeting. Meanwhile, the dollar continues to dominate the pair amid uncertainty over the Fed's rate hike trajectory due to persistent inflation concerns, recession fears, and restricted credit availability.
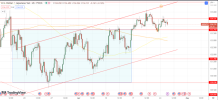
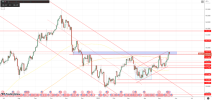
The USDJPY pair is being influenced by the recent rise in US 10-year Treasury yields, which hit 3.65% before retreating. The correlation between the USDJPY pair and Treasury yields suggests a possible correction towards the last support level, especially given the divergence in monetary policies between the US and Japan.
Support: 134.00 – 133.75 – 133.40 Resistance: 134.7 – 135.30 – 135.70
XAUUSD
The Gold price is under pressure due to concerns over an economic recession and hawkish signals from major central banks, despite a recent corrective bounce off the lower line of the channel. The rebound was supported by a pullback in yields and the US Dollar, as there are hopes for China's sustained economic recovery. However, upcoming US preliminary PMIs for April and speeches from Fed policymakers may reinforce hawkish bets and continue to weigh on Gold for a second consecutive week.
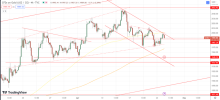
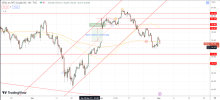
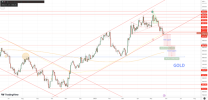
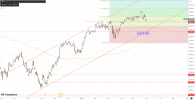
The current price action in gold indicates a strong formation of a bearish trend, with the key support level at 1976. If this level is broken, the bearish trend may gain further strength. While the long-term bullish trend is still in place, the 1995 support level on the daily chart is the key level that is keeping the price higher for now. However, the recent accumulation of price and divergence on RSI may indicate a solid correction may happen soon. The upcoming US preliminary PMIs for April and speeches from Fed policymakers may also influence the gold price movement.
Support: 1987 –1975 – 1950 Resistance: 2011 – 2020 – 2032
UKOIL
The prices of oil have weakened due to concerns about demand. Brent crude, which is the international oil benchmark, has fallen by 1.6% and is now at $81.77 a barrel,. The latest data from the U.S. Department of Energy, which was released on Wednesday, showed a mixed picture. While crude stocks fell by 4.6 million barrels last week, gasoline stocks jumped by 1.3 million barrels, which was unexpected as analysts were anticipating a fall of 1.2 million barrels in gasoline stocks.
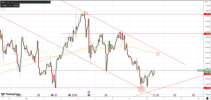
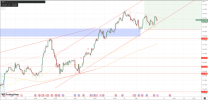
Brent break the confluence point around 79 support level and now going forward to close the gap until 76.
Support:79.00 – 76.00 – 74.00 Resistance: 83.60 – 85.00 – 86.40