• The Forex, Binary Options Forum - welcomes you to our Community!

    DigitalCashPalace Forum is dedicated to discussions about Forex, Binary Options, commodities, stocks related.

    Please take a look around, and feel free to .

"Market Update: US Index Futures Flat, Major Currencies Negative, Precious Metals Down, Asian Markets Decrease, Oil Tumbles, and US Dollar Index Rises"

On Tuesday, several currencies from Asian countries experienced a decline, whereas the value of the dollar increased slightly. This was due to the anticipation surrounding the upcoming interest rate decision from the Federal Reserve, which resulted in market caution. Furthermore, there were ongoing concerns about a banking crisis that added to the negative outlook.
According to sources familiar with the situation, US officials are contemplating various options to temporarily broaden the scope of Federal Deposit Insurance Corporation (FDIC) coverage to include all bank deposits. Bloomberg reported this on Monday.
Investors found some relief on Tuesday following the announcement of the rescue of Credit Suisse, a struggling financial institution, by its Swiss counterpart UBS. However, there is still some unease about the potential for this crisis to cause further disruptions in credit markets and harm smaller US banks.
The focus has now shifted to the upcoming meeting of the US Federal Reserve, with many traders speculating about whether the central bank will continue to raise interest rates, which some blame for causing the crisis, or if there will be a pause in the rate hikes.
The yield on 10-year Treasury notes increased to 3.49%. The 2-10-year yield spread is at -41 bps. However, the 10Y real rate widens to 118 bps today.

EURUSD
Fundamental Outlook:
Goldman Sachs revised its economic growth projection for the eurozone in 2023, citing persistent turmoil in the global banking system and rising economic uncertainty. The investment bank lowered its growth forecast for the region by 0.3%, resulting in a projected GDP growth rate of 0.7% for 2023.

Technical Analysis: The currency pair is experiencing difficulties in breaking above the 50-day moving average and seems to be encountering a barrier at this point once more. This is indicated by the purple line on the chart. However, the 200-day exponential moving average, represented by the yellow line, is providing support from below. Additionally, the 1.0685 level can be considered as a support level. On the other hand, if the pair manages to surpass the 1.0725 level, it will be viewed as a critical resistance level and closely monitored.
Support: 1.0685 – 1.0660 – 1.0605
Resistance: 1.0725 – 1.0760 – 1.0775

GBPUSD
Fundamental Outlook:
Goldman Sachs has revised its economic outlook for the UK, stating that it expects zero economic growth for the country in 2023. Furthermore, the investment bank no longer predicts that the Bank of England (BoE) will raise its policy rate in May. As a result, Goldman Sachs has maintained its forecast for the BoE's terminal rate at 4.25%.

Technical Analysis: The pound has recently broken above the 0.618 Fibonacci retracement level with a long bullish candlestick. If it can maintain its position above this level, there is potential for further upward movement towards the green area on the chart. However, traders should keep a close eye on the 1.2270 level as it could act as resistance and potentially push the pound back down. On the other hand, the 1.2205 level can be seen as a support level and may provide a level of protection for the pound if it experiences any downward pressure.
Support: 1.2205 – 1.2160 – 1.2125
Resistance: 1.2270 – 1.2315 – 1.2365

1679388463689.png


USDJPY
Fundamental Outlook:
There is speculation among analysts that the Bank of Japan (BOJ) will adjust or terminate its Yield Curve Control (YCC) policy during Toshiro Ueda's five-year tenure as the governor. The BOJ's extensive bond purchases aimed at maintaining the yield cap are being criticized for distorting the yield curve's shape and draining liquidity from the bond market. Therefore, many analysts anticipate changes to this policy.

Technical Analysis: The technical analysis of the currency pair suggests a prevailing downtrend, which was further confirmed by a recent breakdown below the previously established uptrend line. This led to a decline below the 50-day moving average, depicted by the purple line, indicating a potential bearish sentiment in the market. In case the support level fails to hold, it could trigger an increase in selling pressure, leading to a possible downtrend. To avoid such a situation, traders should closely watch the 130.55 level, which could serve as a crucial support level. On the other hand, the 132.60 level may act as resistance and halt any upward momentum. However, if the price manages to break above this level, it could attract buyers, potentially causing an uptrend that could surpass the 8-day exponential moving average

Support: 130.55 – 129.85 – 128.35 Resistance: 132.60 – 133.10 – 134.00
1679388495999.png


XAUUSD

Fundamental Outlook:
In early trading on Tuesday, gold prices remained stable and did not experience any significant fluctuations, despite reaching important highs in the previous session. Market participants were taking some profits off the table in anticipation of the Federal Reserve's upcoming interest rate decision. At the same time, the continuing concerns about a potential banking crisis are supporting the demand for safe-haven assets.

Technical Analysis: Gold's strong nine-day rally came to a halt yesterday when the precious metal reached a high of 2009 before encountering profit-taking, leaving a long wick at that level. This suggests that traders were taking profits after the metal broke above the 2000 psychological resistance level. Technically speaking, the short-term resistance level for gold is around 1985. If the profit-taking continues, the metal may find support around the 1968 level. Therefore, traders should keep a close eye on these levels to identify potential trading opportunities.
Support: 1968 – 1950 – 1935
Resistance: 1985 – 2000 – 2009
1679388528331.png


XAGUSD
Fundamental Outlook:
Over the past week, the price of silver increased considerably due to increasing concerns about the possibility of a banking collapse in both the US and Europe. As a result, many investors sought refuge in traditional safe-haven assets such as silver. Furthermore, there are growing expectations that the Federal Reserve may not have the necessary economic conditions to continue raising interest rates, which is negatively impacting the value of the dollar.


Technical Analysis: Silver has been maintaining its uptrend with no signs of a trend reversal. The chart shows a significant resistance level at 22.80. Besides, a pennant formation is visible, which indicates a potential bullish breakout. If the price surpasses the resistance level at 22.80, it could lead to further price increases towards the 23.00 level. On the downside, the 22.30 level, represented by the 50-day simple moving average, is a crucial support level, and traders should monitor it closely for any possible trend reversals. In summary, the technical analysis suggests a bullish outlook for silver, but traders should be cautious and keep an eye on the crucial levels for potential trading opportunities.

Support: 22.30 – 22.02 – 21.80
Resistance: 22.80 – 23.00 – 23.22

1679388555211.png


UKOIL

Fundamental Outlook:
In the early hours of Tuesday, oil prices experienced a decline in Asian trade, interrupting a short-lived recovery from their lowest point in 15 months. This drop in oil prices occurred as investors adopted a cautious stance before the Federal Reserve's upcoming interest rate decision. Additionally, concerns regarding a banking crisis persist and are prompting traders to be more careful with their investments.


Technical Analysis: Brent oil exhibited a series of falling candles before closing yesterday with a long wick candle. This suggests that buyers are active around the 70 levels, and the support at this level is preventing further price declines. The 70.20 level is a critical support level in this respect, and traders should monitor it closely. On the upside, the short-term resistance level to watch is around 74.65. If the price manages to break above this level, it could indicate a potential bullish trend, and traders may look for buying opportunities. However, traders should be cautious and closely watch the support and resistance levels for any potential trend reversals.
Support: 72.40 – 71.85 – 70.20
Resistance: 74.65 – 75.75 – 77.70

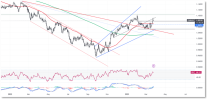
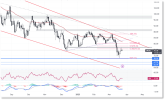
1679388582913.png
 
"Market Update: US Index Futures Flat, Major Currencies Slightly Up, Precious Metals Stable, Asian Markets Decrease, Oil Down, and US Dollar Index Drops"

On Wednesday, many Asian currencies faced a slight decline in trading activity as investors braced themselves for a potential increase in interest rates by the Federal Reserve later in the day. However, due to the diminishing concerns of a banking crisis, regional currencies experienced only minor losses. The Federal Reserve is likely to raise interest rates by 25 basis points due to the fact that inflation is still considerably higher than the central bank's target rate. According to Fed Funds futures prices, the markets are indicating an over 80% chance of a rate hike later in the day.

The dollar did not receive much support as the dollar index and dollar index futures declined slightly and were trading near their lowest levels in five years due to uncertainty over the Federal Reserve's monetary policy outlook. Although Treasury yields rose on Wednesday, they were still trading below the highs reached earlier this year.

Even though concerns over a banking crisis seem to have decreased, raising interest rates further could increase the risk for more lenders, which could then limit the Federal Reserve's ability to tighten its policy. However, before the banking crisis occurred, Powell had expressed a hawkish stance for the central bank, given the high inflation and strong labor market conditions.

The yield on 10-year Treasury notes increased to 3.58%. The 2-10-year yield spread is at -48 bps. However, the 10Y real rate widens to 126 bps today.

EURUSD
Fundamental Outlook:
Lagarde highlighted that the ECB remains committed to its goal of combating inflation and that any market turbulence will not hinder this objective. In fact, she suggested that such instability could potentially aid in achieving the ECB's target. This statement was made in response to concerns expressed by investors and bankers about the likelihood of a financial crisis. Lagarde’s reference to the correlation between the increase of interest rates by central banks and apprehension within the banking industry was due to the fact that both tend to result in reduced lending and hindered economic growth.

Technical Analysis: Based on technical analysis, the Euro has risen above the level where it started to decline with positive bars for four consecutive days after a sharp fall on March 15. Additionally, the 50-day moving average is also positive, indicating a potential bullish sentiment in the market.

However, traders should closely monitor the 1.0800 level as it may act as resistance and potentially push the Euro back down. On the downside, the 50-day moving average level, which was the previous resistance, could act as support at 1.0730.

Therefore, traders should keep a close eye on these key levels to identify potential trading opportunities and manage their risks accordingly. In summary, the technical analysis suggests a potential bullish outlook for the Euro, but traders should exercise caution and closely monitor the crucial levels.
Support: 1.0730 – 1.0685 – 1.0615
Resistance: 1.0800 – 1.0840 – 1.0890


1679472462343.png


GBPUSD
Fundamental Outlook:
Today, the UK is set to release the annual inflation figures for February. It is anticipated that the inflation rate will decrease from 10.1% to 9.9%. The outcome of this data will have a significant impact on the Bank of England's decision regarding its interest rate policy.

Technical Analysis: Based on technical analysis, the pound has broken above the 0.618 Fibonacci retracement level with a long bullish candlestick, indicating the potential for further upward movement toward the green area on the chart. However, traders should closely monitor the 1.2270 level as it may act as resistance and push the pound back down. Alternatively, the 1.2205 level can be viewed as a support level and may provide a level of protection for the pound in the event of any downward pressure. Therefore, traders should keep a close eye on these key levels to identify potential trading opportunities and manage their risks accordingly. Traders should exercise caution and closely monitor the crucial levels to identify potential trading opportunities.
Support: 1.2205 – 1.2160 – 1.2125 Resistance: 1.2270 – 1.2315 – 1.2365

1679472694414.png

USDJPY
Fundamental Outlook:
The dollar strengthened against the yen, which has its yields tightly managed by the Bank of Japan and increased to 132.40. Earlier in the week, the demand for the safe-haven yen had caused the dollar to drop as low as 130.55.

Technical Analysis: Based on technical analysis, the currency pair is currently experiencing a downtrend, which was confirmed by a recent breakdown below the established uptrend line. On the other hand, the price is trying to breach the 50-day moving average, indicating a potential bullish sentiment in the market. If the support level fails to hold, it could lead to increased selling pressure, potentially causing a further decline in prices. To avoid such a situation, traders should closely monitor the 130.55 level, which could serve as a critical support level. On the other hand, the 132.60 level may act as resistance and halt any upward momentum. However, if the price manages to break above this level, it could attract buyers, leading to a potential uptrend that may surpass the 8-day exponential moving average. Traders should exercise caution and monitor the crucial levels to identify potential trading opportunities.

Support: 130.55 – 129.85 – 128.35
Resistance: 132.60 – 133.10 – 134.00


1679472732749.png

XAUUSD
Fundamental Outlook:
On Wednesday, gold prices remained relatively stable, staying within a narrow range after a significant drop in the previous session. This was due to the markets preparing for the Federal Reserve's interest rate decision, and the reduced concerns of a banking crisis, which lowered the demand for the safe-haven asset.

Technical Analysis: Based on technical analysis, gold has experienced a pullback from 2009 levels after a steep rise, and yesterday it fell to the 1935 level. At this level, there is a 0.618 Fibonacci level, which can serve as support. However, if this level is broken, the price may drop to 1913 levels.

If the price movement turns up again, it may encounter resistance at the 1950 level. Therefore, traders should closely monitor the 1935 level for any potential trend reversals, and if the level holds, it may provide a buying opportunity. On the other hand, if the level is broken, it may indicate a further decline in prices.

In summary, the technical analysis suggests a potential support level at 1935 with a 0.618 Fibonacci level, but traders should closely monitor the key levels to identify potential trading opportunities and manage their risks accordingly.

Support: 1935 – 1913 – 1902
Resistance: 1950 – 1967 – 1985

XAGUSD
Fundamental Outlook:
The prices of silver were recovering from significant losses in the prior session, as government intervention eased concerns about a potential crisis in the banking systems of the US and Europe. This led to a decline in demand for silver, which had previously surged to one-year highs due to its appeal as a safe-haven asset amidst market uncertainty.


Technical Analysis: Based on technical analysis, the price of silver has been trending upwards, and there are no indications of a trend reversal. The chart shows a strong resistance level at 22.80, which is a significant level to watch. Additionally, a pennant formation has formed, which suggests a potential bullish breakout. If the price surpasses the resistance level at 22.80, it may lead to further price increases towards the 23.00 level.

On the downside, the 50-day simple moving average at 22.30 is a critical support level, which traders should closely monitor for any possible trend reversals. In summary, the technical analysis suggests a bullish outlook for silver, but traders should exercise caution and keep a close eye on the key levels to identify potential trading opportunities.
Support: 22.30 – 22.02 – 21.80
Resistance: 22.80 – 23.00 – 23.22

1679472784494.png


UKOIL
Fundamental Outlook:
In early Asian trading on Wednesday, oil prices showed a slight decrease as industry data indicated a possible increase in inventories for another week in the largest consumer of crude oil worldwide. Moreover, the Federal Reserve's upcoming interest rate decision led to cautious market plays.


Technical Analysis: Based on technical analysis, Brent oil has been experiencing sharp declines and reached a level of 70.20. However, it has since rebounded to 75 with increased buying pressure. The 75.20 level, which was a previous low, is currently acting as a resistance level. Meanwhile, there is potential support at the 72.85 level. Therefore, traders should closely monitor the price action around these key levels before making any trading decisions.
Support: 72.85 – 71.85 – 70.20
Resistance: 75.20 – 75.75 – 77.70

1679472811541.png
 
"Market Update: US Index Futures Down, Major Currencies Increase, Precious Metals Up, Asian Markets Decrease, Oil Slightly Up and US Dollar Index Sharply Drops"

Yersterday, the expected FED meeting took place and the comitee raised the interest rates by 25 bps to 4.75%-5% that same the expectations. The investors also focussed what Powell say about banking crises and when The FED will start decrease the rates. Powell said strikingly that interest rate increases, together with credit contraction, would be effective in limiting inflation. From this message, the market realized that interest rate hikes will now be limited. Powell added that although the effects of the banking crisis are being evaluated, reducing inflation is still the FED's 1st priority. After the FOMC announcement, DXY fell sharply by 0.8%. This move was spurred by the softer guidance of the FED, which was less hawkish than at previous meetings in the face of recent banking sector turmoil.

There were also important changes in the forecasts for the American economy at the FED's March meeting. It lowered its GDP forecast for 2023 from 0.5% to 0.4%, while lowering the unemployment rate from 4.6% to 4.5%. The PCE inflation forecast for 2023 and 2024 was slightly increased and revised to 3.6% and 2.6%, respectively. Thus, the FED once again reiterated its strong expectations for the American economy and showed that it has a strong hand to raise interest rates. The FED has said many times that the unemployment data will be taken into account when reducing inflation.

EURUSD
Fundamental Outlook:
The pair continued to rise for 6 consecutive days by testing 1.0930, the highest level in the last month with the Fed's rate hike. Janet Yellen assured that depositors in US banks would be insured, but said that poorly managed banks would not be bailed out. As Lagarde recently mentioned, the relationship between central banks' raising interest rates and uneasiness in the banking sector has increased as both lead to reduced lending and hinder economic growth. This makes the pair stronger as DXY depreciates.

Technical Analysis: In a short term, the parity looks bullish because 21DMA crosses 50DMA yesterday. Also, the horizontal line around 1.0800/1.0810 area was broken. In addition, the Relative Strength Index (RSI) (14) is hovering in the bullish range 60.00-80.00, which shows more upside ahead. Technically, above 1.0850 level, the momentum is still bullish. The first resistance at 1.0930, then 1.1033 which is February high level.
Support: 1.0850 – 1.0800 – 1.0760

Resistance: 1.0930 – 1.1035 – 1.1100
1679564651349.png


GBPUSD
Fundamental Outlook:
The sterling jumped the higher of 1.2300 level with the FED meeting. Today, the BoE will hold its March meeting. 25 bps rate hike is expected from the BoE. This interest rate increase will be the 11th meeting in a row, and the policy rate will increase from 4.00% to 4.25%. The February month annualized CPI unexpectedly jumped to 10.4% while the Core figure also increased to 6.2% YoY. The signals about whether the BoE will stop the rate hikes at the next meeting will be decisive for the Pound.

Technical Analysis: Pound remains firmer above 1.22/1.2210 area and heads for 1.2460 level at the top. Technically, the daily RSI (14) is increasing gradually and the eyes focus on BoE meeting today. A dovish 25bps rate hike is already priced in. Thus, the guidance wil help the cable investors to find the direction.

Support: 1.2210 – 1.2135 – 1.2000
Resistance: 1.2400 – 1.2460 – 1.2520

1679564682018.png


USDJPY

Fundamental Outlook:
The Japanese Yen continues to appreciate against the dollar which has its yields tightly managed by the Bank of Japan. Earlier in the week, the demand for the safe-haven yen had caused the dollar to drop as low as 130.55 and the pair is hovering aroun 131.00 level.

Technical Analysis: The Japanese Yen parity turned back six-week low and the ascending suport line from January comes to the 130.40 level. If that level broken, the parity would gain momentum and target to 128.15 which was seen the lowest level on February.

Support: 130.40 – 129.80 – 128.15
Resistance: 132.60 – 133.30 – 135.05

1679564710963.png


XAUUSD
Fundamental Outlook:
Yellow metal reversed the decreasing for two consecutive days with the FED meeting. This was due to the markets realized the dovish FED’s stance and the increased concerns of a banking crisis with Yallen’s speech, which highered the demand for the safe-haven asset. The yield on 10-year Treasury notes increased to 3.47%. The 2-10-year yield spread is at -48 bps. However, the 10Y real rate widens to 114 bps today.

Technical Analysis: Technically, an upside break $1985 leads to make rally untill $2000/2010 region. Further up, the gold need to break the level $2010 which is the year high level. On the downside, the first support level will be $1964 which is the intraday low level, then $1949 (21DMA). Deeper declines may be supported at $1933/35 area.

Support: 1964 – 1949 – 1935
Resistance: 1985 – 2000 – 2010


1679564745212.png


XAGUSD
Fundamental Outlook:
Silver price remains firmer at the highest level since early February. Although the Fed insisted that it would fight for inflation, the signal that the intervention would increase through credit contraction was perceived positively for metals. Also, metals remain a safe haven for the banking crisis.

Technical Analysis: The 50-day simple moving average at 22.30 is a critical support level, which traders should closely monitor for any possible trend reversals. If the break comes, the level 21.70 can be seen closely as support. On the upside, Silver set to retake 24.00/24.30 region.

Support: 22.60 – 21.70 – 20.60
Resistance: 24.30 – 24.65 – 26.00
1679564771289.png


UKOIL

Fundamental Outlook:
After the FED's interest rate decision risk appetite is higher and black metal benefited from this appetite but is limited. Also, media reports suggested that OPEC+ will likely keep output unchanged next month, despite a recent crash in prices. That said, the weekly Crude Oil inventory data from the US Energy Information Administration (EIA) signaled that the stockpile grew 1.117M versus expected prints of -1.448M and 1.55M prior.

Technical Analysis: Brent oil approaches 78.55 level which is the fibonacci %50 level from 86.70 level to 70.20 level. Still, the bullish momentum is seen on ukoil, but fears of recession is on the table. Above 78.55 level, the resistance may be at 80.45 level. On the downside, 70.20 will be the main support level.
Support: 74.55 – 72.90 – 70.20
Resistance: 77.65 – 78.55 – 80.40

1679564800976.png
 
"Market Update: US Index Slightly Up, Major Currencies Flat, Precious Metals Drops, Asian Markets Decrease, Oil Rises, and US Dollar Index Stable"

After meetings of the Federal Reserve, Swiss National Bank, and Bank of England, the focus is now on the March PMI data which is being announced today. Investors are also closely watching the banking crisis. Gold prices dipped slightly when US Treasury Secretary Yellen mentioned the possibility of taking further action for the banking sector if needed. Meanwhile, the 10-year US bond remained stable at 3.40%, but the real interest rate fell to 120 basis points.

Moreover, the amount of funding offered by the FED through cheap liquidity windows is increasing, indicating that the US banking sector still requires liquidity.

The yield on 10-year Treasury notes decreased to 3.40%. The 2-10-year yield spread is at -51 bps. However, the 10Y real rate widens to 120 bps today.


EURUSD

Fundamental Outlook:
On Friday, it is expected that the European Central Bank will provide reassurances to European Union leaders regarding the safety of banks in the euro zone, following market instability caused by Swiss and U.S. banks. However, officials have indicated that the ECB may also call on EU leaders to continue working towards the implementation of a deposit insurance scheme in order to strengthen the banking system.

Technical Analysis: The European region is anticipating the release of PMI data which will determine the market trend. A strong PMI figure may lead to the testing of the 1.1030/35 region, previously observed in February. The resistance level stands at 1.0930, and if crossed, the significant level to watch out for is 1.1030/35. However, if the PMI data is weak, the support zone is likely to be around 1.0770/75. In the event of a breakdown, the next level to monitor is 1.0675. Therefore, traders must closely monitor these critical levels to identify potential trading opportunities and manage their risks accordingly.

Support: 1.0770 – 1.0675 – 1.0615
Resistance: 1.0850 – 1.0930 – 1.1030
1679648132380.png


GBPUSD
Fundamental Outlook:
The Bank of England (BoE) increased interest rates for the 11th consecutive time. However, the bank also stated that the unexpected surge in inflation is likely to be temporary, leading to speculations that this may be the end of the rate hikes.

Technical Analysis: The pound has broken above the 0.618 Fibonacci retracement level, which suggests further upward movement towards the green area on the chart. This is supported by a long bullish candlestick. However, traders should be cautious and keep a close eye on the resistance level of 1.2325, which may potentially halt the upward momentum and lead to a reversal. Conversely, the support level at 1.2205 may offer protection against any downward pressure on the pound. Therefore, traders must closely monitor these critical levels to identify potential trading opportunities and manage their risks accordingly.

Support: 1.2205 – 1.2160 – 1.2125
Resistance: 1.2325 – 1.2375 – 1.2440

1679648178535.png


USDJPY
Fundamental Outlook:
It is expected that the annual core inflation in Japan for February will have decreased significantly to 3.1%, from the previous month's 41-year high of 4.2%. This is largely due to the government's provision of subsidies for gas and electricity bills, which was aimed at mitigating the impact of rising living costs. However, despite this decline, several economists have suggested that there are still strong pricing pressures across the economy, which may result in the Bank of Japan phasing out or abandoning its yield curve control policy in the near future.

Technical Analysis: Based on technical analysis, the currency pair is currently experiencing a downtrend with consistent red bars, which was confirmed by a recent breakdown below the established uptrend line. Traders should closely monitor the 129.85 level, which could serve as a critical support level. On the other hand, the 132.35 level may act as resistance and halt any upward momentum. However, if the price manages to break above this level, it could attract buyers, leading to a potential uptrend that may surpass the 8-day exponential moving average. Traders should exercise caution and monitor the crucial levels to identify potential trading opportunities.
Support: 129.85 – 128.35 – 127.35
Resistance: 131.10 – 132.35 – 133.30


1679648209268.png


XAUUSD

Fundamental Outlook:
On Friday, the prices of gold remained close to important levels and surpassed the dollar for the third consecutive week. This was due to indications of a Federal Reserve with less hawkish views and instability in the banking industry, which prompted traders to turn to gold as a preferred safe haven.

Technical Analysis: Based on forex technical analysis, the market is currently observing a resistance zone between 2000/2010. This level has been historically significant and has been followed by traders in the past. However, in the short term, the support level to watch out for is 1978. In the event of a breakdown below this level, a strong support zone can be expected around 1962/64. Therefore, traders must closely monitor these critical levels to identify potential trading opportunities and manage their risks accordingly.

Support: 1978 – 1962 – 1935

Resistance: 2000 – 2010 – 2050

1679648243630.png


XAGUSD

Fundamental Outlook:
The prices of silver were declining from significant gains in the prior session, as government intervention eased concerns about a potential crisis in the banking systems of the US and Europe. This led to a decline in demand for silver, which had previously surged to one-year highs due to its appeal as a safe-haven asset amidst market uncertainty.

Technical Analysis: Based on technical analysis, the price of silver has been trending upwards, and there are no indications of a trend reversal. The chart shows a strong resistance level at 23.25, which is a significant level to watch. Additionally, a pennant formation has formed, which suggests a potential bullish breakout. If the price surpasses the resistance level at 23.25, it may lead to further price increases towards the 24.30 level.

On the downside, the 50-day simple moving average at 22.25 is a critical support level, which traders should closely monitor for any possible trend reversals. In summary, the technical analysis suggests a bullish outlook for silver, but traders should exercise caution and keep a close eye on the key levels to identify potential trading opportunities.

Support: 22.80 – 22.25 – 22.02

Resistance: 23.25 – 23.45 – 24.30

1679648287663.png


UKOIL

Fundamental Outlook:
On Friday, during the Asian trade, the prices of oil experienced a decline that continued from the previous session. This was due to the announcement by U.S. officials that refilling the Strategic Petroleum Reserve (SPR) would not be an easy task. Furthermore, concerns over the production of OPEC also contributed to the fall in oil prices.

Technical Analysis: Based on technical analysis, Brent oil has been experiencing sharp declines and reached a level of 70.20. However, it has since rebounded to 75 with increased buying pressure. The 75.20 level, which was a previous low, is currently acting as a resistance level. Meanwhile, there is potential support at the 72.85 level. Therefore, traders should closely monitor the price action around these key levels before making any trading decisions.
Support: 74.30 – 72.85 – 70.20

Resistance: 76.50 – 77.25 – 80.35
 

Attachments

  • 1679648103923.png
    1679648103923.png
    141.7 KB · Views: 58
  • 1679648344007.png
    1679648344007.png
    158.2 KB · Views: 54
  • 1679648449629.png
    1679648449629.png
    158.2 KB · Views: 52
EURUSD
Fundamental Outlook:
Gediminas Simkus, a member of the Governing Council, made a statement regarding the banks operating within the euro system. According to him, these banks operate under different rules and regulations, which makes them more resilient to financial shocks. They have substantial capital buffers, high liquidity, and are generating profits due to the increasing interest rates. Recently, the ECB raised the interest rates by 50 basis points, which shows their confidence in the banks' ability to withstand any financial challenges that may arise in the future. However, the officials are still fighting against inflation and are keeping a close eye on the upcoming inflation data. The data is expected to show a decrease in annual CPI gains in February, but there might be an increase in underlying inflation. This emphasizes the importance of the ECB remaining vigilant to ensure the stability of the financial system.

Technical Analysis: The currency pair maintains its bullish momentum and has found support from the 8-day exponential moving average, as indicated by the red line on the chart. The pair attempted to breach the 1.0930 level but retreated to 1.0714, marking a minor pullback in the trend. Presently, the pair is trading above the crucial 0.618 Fibonacci retracement level, implying further bullish momentum. If the pair breaks above the resistance level at 1.0825, this may trigger more buying pressure and extend the uptrend. On the other hand, traders might watch for the 8-day exponential moving average at 1.0775, which could serve as a possible support level in case of a downside correction.

Support: 1.0775 – 1.0725 – 1.0675
Resistance: 1.0825 – 1.0855 – 1.0910

1679992175860.png


GBPUSD
Fundamental Outlook:
The Bank of England increased its primary interest rate to 4.25% from 4%, following an unexpected rise in the annual consumer price inflation rate to 10.4% in February, as per official figures released on Wednesday. Governor Andrew Bailey reiterated that the Bank of England anticipates a significant decline in inflation this year since last year's sharp rise in energy prices would no longer be a factor in year-on-year price comparisons. He expressed his relief that inflation had stabilized.

Technical Analysis: The pound has shown potential for continued upward momentum, as long as it remains above the 8-day exponential moving average. Traders should keep a close eye on both the 8 EMA and the crucial 0.618 Fibonacci retracement level, as they could indicate any possible trend reversals. The 1.2245 level is a possible support level to watch for, while the 1.2345 level could act as resistance, limiting the currency's upward movement towards the green area on the chart. As such, traders should remain vigilant and manage their trades carefully in the coming sessions.
Support: 1.2245 – 1.2205 – 1.2160
Resistance: 1.2345 – 1.2365 – 1.2425

1679992216478.png

USDJPY
Fundamental Outlook:
On Tuesday, Asian currencies saw a surge in value, led by the Japanese yen. Meanwhile, the US dollar declined as traders became less worried about an upcoming banking crisis and shifted towards investments with higher risk.

Technical Analysis: The currency pair has been trending downwards for a considerable period, but there has been a recent rebound from its lowest level at 129.66. Traders should keep a keen eye on the resistance level at 131.80, as it could pose a significant challenge for the pair's upward movement. On the other hand, support could be found at the 130.50 level, which may act as a possible anchor for the currency's price action.
In the past, we have observed trend reversals in this pair that were signaled by long wick bars. These candles have long shadows that either extend above or below the body of the candle, indicating that there has been significant price action in both directions. While these candles may signal a potential reversal, traders should be cautious and wait for more positive price action to confirm any such changes in trend. As always, traders should manage their trades carefully and implement proper risk management techniques to mitigate any potential losses.

Support: 130.50 – 129.70 – 128.35
Resistance: 131.80 – 132.85 – 133.80

1679992242344.png

XAUUSD
Fundamental Outlook:
At the beginning of Tuesday's Asian trading session, gold prices went up, but still remained significantly below their recent peak levels. This was due to the fact that the stock market had experienced gains and investors had become more optimistic about the likelihood of a U.S. banking crisis being averted, leading them to shift away from safe haven assets such as gold.

Technical Analysis: Gold has encountered significant challenges in sustaining its price above the key psychological level of 2000, which has once again acted as a strong resistance. This suggests that there is still significant selling pressure in the market, and traders should be cautious when trading this yellow metal. The next possible support level to monitor is the 8-day exponential moving average, represented by the red line on the chart, which currently has support at 1959.

It is also worth noting that the price action in the recent candles has shown a tendency for the price to drop below the 8 EMA, which could be a sign of further bearish momentum. If this scenario plays out, we could see the price of gold fall towards the 1935 level, which is regarded as a strong support level in the short term. This level has historically acted as a crucial support level, and traders should monitor it closely for any potential trend reversals or breakout opportunities.

On the upside, the 1980 level could act as a significant resistance, limiting the upward movement of gold in the short term. If the price manages to break through this resistance level, it could trigger a further uptrend, which could potentially test the 2000 level once again. However, traders should remain vigilant and manage their positions accordingly, as gold has been known to be a volatile asset that can be subject to sudden price swings. As always, proper risk management techniques should be implemented to mitigate any potential losses.

Support: 1945 – 1935 – 1919
Resistance: 1980 – 2000 – 2010


1679992276615.png


XAGUSD

Fundamental Outlook:
On Monday, the price of silver dropped significantly, largely due to repeated assurances of stability in the banking sector. These reassurances helped alleviate fears of a more widespread financial crisis following the collapse of multiple banks earlier in the month.

Technical Analysis: Silver has been displaying a robust uptrend, but it recently encountered resistance near the 23.50 level, which has been a significant hurdle for the metal. However, the 8-day exponential moving average represented by the red line has been providing support for the ongoing uptrend. If silver experiences a further correction, traders should pay close attention to the 22.70 level as it could potentially act as a support level. It is also worth noting that the price has fallen below the uptrend channel, which could indicate a potential shift in the trend. However, the 8-day exponential moving average remains a key level to monitor to assess the strength of the uptrend.

Support: 22.70 – 22.25 – 22.02
Resistance: 23.25 – 23.50 – 24.30

1679992307923.png


UKOIL
Fundamental Outlook:
Oil prices saw a minor dip during early Asian trade on Tuesday, following a surge in the previous session. The market was assessing the possibility of limited supply in the near future, while also taking into account the increasing political disruptions in certain regions of Europe.

Technical Analysis: In the previous bulletin, we highlighted the selling pressure affecting Brent oil but towards the end of the day, the price rebounded slightly, indicating that there are buyers interested in purchasing at current price levels. This suggests that the selling pressure may be weakening, and we could potentially see a shift towards bullish momentum in the coming days.
In the short term, the 76.50 level can be considered a support level for Brent oil, as it has held strong in recent trading sessions. If the price manages to break through this support level, it could potentially trigger a further downward movement, possibly towards the 75.00 level.

On the other hand, resistance can be found at the 0.5 Fibonacci level of 78.40. This level has historically acted as a significant resistance level, and traders should monitor it closely for any potential breakout opportunities. If the price manages to break through this resistance level, it could signal a potential uptrend, possibly towards the 80.00 level.
As always, proper risk management techniques should be employed when trading Brent oil, as it is a volatile asset that can be subject to sudden price swings. Traders should remain vigilant and stay up to date with any market news or events that could impact the price of this commodity.

Support: 76.50 – 74.60 – 72.95
Resistance: 78.45 – 80.35 – 82.25
 

Attachments

  • 1679992333299.png
    1679992333299.png
    133.2 KB · Views: 58
  • 1679992263028.png
    1679992263028.png
    126.5 KB · Views: 57
"Market Update: US Index Positive, Major Currencies Decrease, Precious Metals Drops, Asian Markets Down, Oil Increases, and US Dollar Index Rises"

On Wednesday, currencies from Asian countries lost value due to the decrease in worries over a potential banking crisis. This led to a rapid increase in Treasury yields, which in turn renewed expectations that the Federal Reserve can continue to increase interest rates.
Investors in the US stock market saw slight losses on Tuesday as they considered comments made by Michael Barr, the top banking regulator at the Federal Reserve. Barr spoke to a Senate panel and stated that Silicon Valley Bank had performed poorly in terms of risk management prior to its collapse. Additionally, investors sold shares in technology-related companies that had recently experienced strong gains.

The concept that the Federal Reserve may have limited policy tightening room had caused a surge in U.S. Treasury yields during overnight trading. Despite this, yields were still lower than earlier highs in the year, likely due to the Fed signaling its approach to reaching terminal rates, which could lead to a pause in rate hikes. In March, concerns over a US banking crisis had previously caused the dollar to suffer, as many investors believed that the Fed would be unable to implement significant policy tightening.
The safe-haven US dollar experienced difficulty in recovering from two consecutive days of losses. This was due to global financial markets exhibiting some stability, which led to hopes that a severe banking crisis could be avoided. As a result, demand for the US dollar as a safe-haven asset decreased.

The yield on 10-year Treasury notes increase at 3.57%. The 2-10-year yield spread is at -47
bps. However, the 10Y real rate widens to 126 bps today.

EURUSD
Fundamental Outlook:
The euro managed to rebound above the 1.08 level as concerns about a global banking crisis and recession diminished, after First Citizens BancShares purchased all deposits and loans of Silicon Valley Bank on Monday. Meanwhile, investors are awaiting important Euro Area inflation data which is due to be released on Friday. It is anticipated that the euro will continue to strengthen against the US dollar, as the difference in policies between the European Central Bank and the US Federal Reserve is expected to widen.

Technical Analysis: The currency pair maintains its bullish momentum and has found support from the 8-day exponential moving average, as indicated by the red line on the chart. The pair attempted to breach the 1.0930 level but retreated to 1.0714, marking a minor pullback in the trend. Presently, the pair is trading above the crucial 0.618 Fibonacci retracement level, implying further bullish momentum. If the pair breaks above the resistance level at 1.0850, this may trigger more buying pressure and extend the uptrend. On the other hand, traders might watch for the 8-day exponential moving average at 1.0775, which could serve as a possible support level in case of a downside correction.

Support: 1.0775 – 1.0725 – 1.0675
Resistance: 1.0850 – 1.0885 – 1.0930
1680079110856.png


GBPUSD

Fundamental Outlook:
The pound sterling managed to recover and rise above $1.23, following comments made by Bank of England Governor Andrew Bailey. Bailey suggested that further monetary tightening may be necessary if there are signs of ongoing inflationary pressure. He also acknowledged that there were challenges in the global banking sector, but noted that banks in Britain were strong and capable of supporting the economy.

Technical Analysis: Today's technical analysis suggests that the British pound may maintain its upward momentum, provided that it stays above the 8-day exponential moving average. Traders should closely monitor the 8 EMA and the critical 0.618 Fibonacci retracement level, which may indicate any potential trend reversals. To take note of possible support and resistance levels, traders should watch the 1.2245 level as a support and the 1.2345 level as a resistance, which may hinder the currency's upward movement towards the green area on the chart. Therefore, traders should exercise caution and carefully manage their trades in the upcoming sessions.

Support: 1.2245 – 1.2205 – 1.2160
Resistance: 1.2345 – 1.2365 – 1.2425

1680079140641.png


USDJPY
Fundamental Outlook:
The Japanese yen experienced the largest decline in comparison to other Asian currencies, falling by 0.6%. The reduction in the yen's appeal was due to a decrease in demand for safe-haven assets. In addition, the Bank of Japan's preferred inflation measure, the Core Consumer Price Index, decreased beyond the expected amount in March.

Technical Analysis: The currency pair has experienced a notable downtrend, but it has recently rebounded from its lowest level at 129.66. It tends to go up if it go above the 8 EMA. Traders should pay close attention to the resistance level at 132.85, which may pose a significant obstacle for the pair's upward momentum. Conversely, the 130.50 level could serve as a potential support level and help anchor the currency's price action.

Past trends in this pair have revealed long wick bars as potential signals of trend reversals. These bars feature long shadows that extend above or below the body of the candle, indicating significant price action in both directions. While these candles may suggest a potential reversal, traders should exercise caution and wait for more favorable price action to confirm any changes in trend. As always, traders should manage their trades prudently and use proper risk management strategies to minimize potential losses.

Support: 130.50 – 129.70 – 128.35
Resistance: 132.85 – 133.90 – 134.85

1680079167825.png


XAUUSD
Fundamental Outlook:
During Wednesday's trade, gold prices experienced a decline due to two factors. Firstly, there was a significant increase in Treasury yields which occurred overnight, putting pressure on gold prices. Secondly, regulators gave further reassurance that there was no imminent widespread banking crisis in the US, which may have contributed to the decrease in demand for gold as a safe-haven asset.

Technical Analysis: Gold is struggling to maintain its price above the key psychological level of 2000, which is acting as a strong resistance. This indicates significant selling pressure, and traders should be cautious. The next support level to monitor is the 8-day exponential moving average at 1959. Recent price action has shown a tendency for the price to drop below the 8 EMA, which could lead to further bearish momentum towards the 1935 level. This level has historically acted as a strong support level, and traders should monitor it for any potential trend reversals or breakout opportunities. On the upside, the 1980 level could limit the upward movement of gold in the short term. If it breaks through, it could trigger an uptrend testing the 2000 level once again.

Support: 1945 – 1935 – 1919
Resistance: 1980 – 2000 – 2010

1680079192999.png

XAGUSD
Fundamental Outlook:
Despite the decline in silver prices, investors still maintained their interest in the precious metal. In fact, many investors have been building their long positions on bullion prices in recent weeks due to concerns that the recent collapse of several US banks could have long-term effects on the economy. This suggests that gold remains a popular choice for investors seeking to hedge against potential economic risks.

Technical Analysis: Silver has exhibited a strong upward trend, but it has recently faced resistance near the 23.50 level, which has been a significant obstacle for the metal. Despite this, the 8-day exponential moving average, represented by the red line, has been acting as a support level for the current uptrend. In the event of a further decline in silver's price, traders should keep a close eye on the 22.70 level as it could potentially serve as a support level. Additionally, it is noteworthy that the price has dropped below the uptrend channel, which may indicate a potential shift in the trend. However, the 8-day exponential moving average remains a crucial level to monitor to evaluate the strength of the uptrend.
Support: 22.70 – 22.25 – 22.02
Resistance: 23.25 – 23.50 – 24.30


1680079226367.png


UKOIL
Fundamental Outlook:
In the early hours of Wednesday's Asian trade, oil prices increased, continuing their upward trend for a third consecutive session. The rise in prices can be attributed to interruptions in the shipment of Kurdish oil, as well as a possible substantial decrease in US inventories. These factors indicate a potentially tighter supply of oil in the short term.

Technical Analysis: Brent oil recovered 50% of its losses after the sharp fall. This region, which comes to the Fibonacci 0.5 level, can act as resistance. Above, 80.35 region can be viewed as resistance. On the downside, 76.50 level can be followed as support.As always, proper risk management techniques should be employed when trading Brent oil, as it is a volatile asset that can be subject to sudden price swings. Traders should remain vigilant and stay up to date with any market news or events that could impact the price of this commodity.

Support: 76.50 – 74.60 – 72.95
Resistance: 80.35 – 82.50 – 86.55

1680079254655.png
 
Market Update: US Index Positive, Major Currencies Mixed, Precious Metals Rise, Asian Markets Stable, Oil Increases, and US Dollar Index Up"

On Thursday, many Asian currencies remained stable as investors exercised caution due to upcoming significant Chinese economic data. However, the fear of a banking crisis decreased, leading to a significant increase in Treasury yields and a rebound in the value of the dollar.

The rise in Treasury yields and the strengthening of the dollar also contributed to the downward pressure on gold prices. Investors were more optimistic about the economic outlook, as the fear of a banking crisis had decreased, leading them to anticipate more interest rate hikes by the Federal Reserve in the near future.

According to regulators, the recent failures of some US banks were due to inadequate risk management, but the banking system as a whole was deemed resilient. This gives the Federal Reserve more leeway to continue raising rates to combat inflation and strengthen the economy.
Due to the easing of inflation from a three-decade high, it is anticipated that Australian interest rates will soon reach their highest point. The Reserve Bank of Australia is expected to announce a potential rate hike before taking a break from further increases.
The yield on 10-year Treasury notes decreases at 3.54%. The 2-10-year yield spread is at -53 bps. However, the 10Y real rate tightens to 120 bps today.

EURUSD

Fundamental Outlook:
The President of the European Central Bank (ECB), Christine Lagarde, has stated that the bank is resolute in its commitment to bring inflation back to its target, and this will not involve making trade-offs. Meanwhile, ECB board member Isabel Schnabel has suggested that the bank may explore novel methods to manage liquidity in the banking industry and guide short-term interest rates in the market. On the other hand, financial markets are pricing in a higher likelihood of the US Federal Reserve keeping rates unchanged in May and cutting them in July.

Technical Analysis: Today's technical analysis shows that the Euro is currently on an upward trend, having distanced itself from the 8-day exponential moving average. It may come closer. The pair could find support in this region if it manages to remain on the rising trend. However, a trend break could result in a drop towards the 8 EMA. If this occurs, the support level to watch is at 1.0775, which also coincides with the 0.618 fibonacci level. On the other hand, in the short term, a resistance level of 1.0850 is significant and could pose a challenge for the pair to overcome.

Support: 1.0775 – 1.0725 – 1.0675
Resistance: 1.0850 – 1.0885 – 1.0930

1680167252213.png


GBPUSD
 

Attachments

  • 1680167281324.png
    1680167281324.png
    156.7 KB · Views: 51
  • 1680167315022.png
    1680167315022.png
    142.5 KB · Views: 52
  • 1680167342429.png
    1680167342429.png
    151.2 KB · Views: 57
  • 1680167370644.png
    1680167370644.png
    149.5 KB · Views: 54
  • 1680167398083.png
    1680167398083.png
    154.2 KB · Views: 65
"Market Update: US Index Positive, Major Currencies Mixed, Precious Metals Rise, Asian Markets Stable, Oil Increases, and US Dollar Index Up"

On Friday, Asian currencies mostly remained stable, while the value of the dollar decreased due to indications of a weakened job market. Attention has now shifted towards the upcoming report on the Federal Reserve's preferred measurement of inflation.

Earlier today, data on purchasing managers' index (PMI) showed that while the service sector in China grew at the fastest pace in 12 years in March, manufacturing activity slowed down compared to the previous month. This suggests an uneven recovery in Asia's biggest economy and a significant export market for European companies.

Later today, the focus will be on Eurozone inflation data, which is expected to show an annual CPI growth of 7.1% in March, down from the previous month's 8.5%. However, there is a possibility of an upside surprise following the stronger-than-expected German figures released on Thursday. The markets have already priced in another 50 basis points in rate hikes from the European Central Bank this year, and a higher-than-expected inflation number is likely to confirm this expectation.

Onthe other side of the Atlantic, the core PCE price index, the Federal Reserve's preferred inflation gauge, is also due to be released later today. This could offer clues about the central bank's future stance on interest rates, with policymakers needing to be cautious while the effects of fragile bank confidence continue to ripple through the economy.

The yield on 10-year Treasury notes decreases at 3.54%. The 2-10-year yield spread is at -53 bps. However, the 10Y real rate widens to 126 bps today.


EURUSD


Fundamental Outlook:
The latest inflation data from Germany indicates a significant easing in inflation in March, mainly driven by lower energy prices. Despite the decrease, the inflation rate still surpassed expectations, adding to the pressure on the European Central Bank to continue tightening its monetary policy. Inflation data for the wider Eurozone region is expected to be released today, and it is predicted that the inflation rate will decrease from 8.5% to 7.1% annually. This data is expected to be closely monitored by investors in the Euro currency.

Technical Analysis: The Euro has been displaying a consistent bullish trend, with consecutive positive bars. However, it recently faced a minor setback from its earlier high of 1.0930, and is now trading around this level. 1.0930 is a significant resistance level, and if it manages to break through it, the next potential target could be the 1.1000 levels observed in early February. Conversely, if a correction occurs, the levels of 1.0875 and 1.0840 could act as potential support levels.

Support: 1.0875 – 1.0840 – 1.0775
Resistance: 1.0930 – 1.0985 – 1.1030


1680252956032.png


GBPUSD
Fundamental Outlook: According to a report by mortgage lender Nationwide, house prices in the United Kingdom experienced their most significant annual decline since the financial crisis in March. The report stated that there was a 3.1% year-on-year drop in house prices, marking the most substantial decline since July 2009. Additionally, when compared to February 2021, house prices were 0.8% lower.

Technical Analysis: The pound has maintained its bullish trend and showed further gains yesterday, supported by the 8-day exponential moving average. Today, the currency retraced slightly from the line drawn and currently trades around the 1.2425 level. Breaking above this level may lead to testing the next resistance at 1.2440. On the other hand, if there is a pullback, the support levels to watch for are at 1.2365 and 1.2310.
Support: 1.2365 – 1.2310 – 1.2202
Resistance: 1.2425 – 1.2440 – 1.2495
1680252980732.png

USDJPY

Fundamental Outlook:
On Friday, a senior official from the International Monetary Fund (IMF), Ranil Salgado, recommended that the Bank of Japan should consider allowing longer-term interest rates to move more flexibly while continuing with its ultra-loose monetary policy. Salgado stated that the central bank could alleviate the pressure on financial institutions by allowing the longer end of the curve to move more freely under its bond yield control policy.

Technical Analysis: The currency pair is showing a bullish trend with an upward movement after a recent downtrend. The pair encountered resistance at the 0.382 Fibonacci level but appears to have broken through this level today. If this breakthrough is sustained, the next resistance level it will face is at 133.85. The fact that the pair has broken above the 8-day Exponential Moving Average (EMA) is considered a positive signal by technical analysts. On the downside, the 132.85 level can be seen as a potential support level for any corrections.

Support: 132.85 – 132.25 – 131.50
Resistance: 133.85 – 134.80 – 136.20

1680253006565.png


XAUUSD

Fundamental Outlook:
On Friday, gold prices remained stable and continued to hover near the significant $2,000 mark after experiencing volatile swings earlier this week. However, due to the potential for a banking crisis and increased safe-haven demand, gold is expected to see a significant rise in value this quarter.

Technical Analysis: Gold's price has been trading horizontally after experiencing a notable uptrend. Notably, the 1980 level, which represents the 0.618 Fibonacci retracement level of the 2003-1944 movement, is currently serving as a crucial resistance point. A breach of this level would signal a potential move towards the 2000 levels. Conversely, the 0.382 Fibonacci retracement level of 1966 is currently acting as a significant support level. It is worth noting that this level also coincides with the 8-day Exponential Moving Average (EMA) level.

Support: 1966 – 1935 – 1919
Resistance: 1980 – 2000 – 2010

1680253035327.png


XAGUSD
Fundamental Outlook:
Throughout this week, silver prices were close to reaching the $24 mark before experiencing a surge on Thursday. This rally was due to U.S. jobless claims being higher than expected, which indicated a cooling in the job market. As a result, inflation could potentially drop, leading to an increase in the value of silver.

Technical Analysis: Silver has shown a strong upward trend, supported by the 8-day exponential moving average. However, the RSI indicator suggests that the price may have entered the overbought zone, which could lead to a correction towards the 8 EMA. The 23.25 level is an important support that should be watched closely. On the upside, the 24.00 level will be a key resistance, and if the price manages to break above it, the 24.30 level may become relevant.
Support: 23.25 – 22.95 – 22.70
Resistance: 23.95 – 24.30 – 24.65

1680253065574.png


UKOIL
Fundamental Outlook:
On Friday, the prices of oil remained relatively unchanged as the release of Chinese business activity data provided conflicting signals regarding the economy of the world's leading importer of crude oil. Additionally, market participants were awaiting further guidance from an upcoming OPEC meeting.

Technical Analysis: Fibonacci levels showed that Brent oil had recovered 50% of its previous losses after experiencing a sharp decline. Currently, it is trading in the horizontal area. The price encountered strong resistance at the Fibonacci 0.5 level and subsequently underwent a pullback. It is worth noting that the 78.45 level is also a crucial resistance point. In terms of support, traders may look towards the 76.50 level on the downside. Given the volatility of Brent oil, it is essential to exercise proper risk management techniques when trading. Traders must remain alert and keep themselves informed about any market news or events that could affect the commodity's price.


Support: 76.50 – 74.60 – 72.95
Resistance: 78.45 – 82.50 – 86.55

1680253093753.png
 
‘Market Update: OPEC+ made a surprise with a voluntary cut’

In parallel with the increase in oil prices, the market started a mixed week with the concerns that the costs have increased and this will be reflected in the prices. This means FED's fight against inflation may become more difficult due to the fear that costs will increase and this will be reflected in prices.
Also, ISM manufacturing index announced in the USA yesterday with a decrease to 46.3 from 47.7 in March. A value below 50 shows that there is a contraction in the sector. Also, the data was the lowest since the pandemic. In other words, the rising interest rates, recession concerns and tightening credit conditions are putting pressure on companies.

In addition, the uncertainty created by the banking crisis in the markets, the unexpected OPEC+ oil supply cut leading the upward price movement in the oil price and the slowdown in growth may put pressure on the markets, especially on stock pricing.

On the other hand, it was announced by the US Federal Deposit Insurance Corporation (FDIC) that the loan portfolio of Signature Bank, which triggered the banking crisis in the USA, would be sold. The bank has a loan portfolio of approximately 60 billion dollars.

Furthermore, the Reserve Bank of Australia (RBA) remained unchanged the cash rate at 3.60% with a further tightening statement. The rest of the day, traders will focus on US Factory orders or US JOLTS data. Also, the central banks officials have a speech during the day.
Today, US10 year Treasury yield is trading around %3.43. The 2-10-year yield spread is at -56 bps and US 10Y real rate falls to 114 bps.

EURUSD
Fundamental Outlook:
The pair jumped with the PM data announced yesterday and is currently trying to reach the highest level of the last 2 months with 1.0915 levels. The S&P Global Eurozone Manufacturing PMI of 47.3 in March 2023 was little changed from expectations of 47.1, but fell from the previous month's 48.5, indicating that the possibility of a recession is on the table. Although the PMI data points to stagnation, it continues its search for a near-term peak with the jump it made with the data from the USA.

Technical Analysis: The Euro returned quickly from 1.0790 level and then tested above 1.0915. The area 1.0930/35 remains the key resistance level. Yet, the 21-DMA crosses the 50-DMA that indicates bullish trend. If the parity breaks that area, the next potential target could be 1.1035 level. Below, the 1.0795 (yesterday’s low level) may be support, then 1.0730.

Support: 1.0795 – 1.0730 – 1.0675
Resistance: 1.0930 – 1.1035 – 1.1055


1680600536361.png


GBPUSD
Fundamental Outlook:
The cable continues its strong rise against the dollar. Huw Pill's speech at the BoE will be followed closely today. The speech is expected to ease expectations for tightening, and in this case, the sterling could show some weakness against the dollar. The March PMI data, which came yesterday, was 47.9, well below the expectations of 48.0 and last month, which was 49.3, increasing the recession concerns.

Technical Analysis: The pound remains bullish trend and showed further gains yesterday, supported by the 8-day exponential moving average. Today, the parity is trying to break 1.2425/30 resistance area. If the area broken, the round number 1.2500 will be the next resistance. On the downside, if there is a pullback, the support levels to watch for are at 1.2350 and 1.2275.
Support: 1.2350 – 1.2275 – 1.2190
Resistance: 1.2425 – 1.2500 – 1.2650

1680600524008.png


USDJPY
Fundamental Outlook:
The reaction is looking for an uptick as the Dollar slumps as low as 130 against the Japanese Yen. With the production cut from OPEC+, the possibility of a US interest rate hike weakened against the Japanese yen dollar, falling to 133, a 2-week low. On the other hand, the possibility of Japan Monetary Policy Committee members to maintain a dovish stance increased with the minutes. This increased the weakness of the Japanese yen against the dollar. The PMI data announced yesterday came in at 49.2, well above the expectations and last month, giving signals of improvement in the Japanese economy.

Technical Analysis: The currency pair is showing a consolidation 132.20-133.75 level. Also, upward momentum is slowing because of the fact that FED will maintain rate hike to fight inflation. In addition, the 21-DMA is trying to break down the 50-DMA. The indicator could be bearish for the parity. On the downside, the 132.20 level can be seen as a potential support level for any corrections, then 131.20. On the contrary side, the first resistance level may be at 133.75. More upside moves could be limited 135.15 level.

Support: 132.20 – 131.20 – 130.40
Resistance: 133.75 – 134.75 – 135.15
 

Attachments

  • 1680600571642.png
    1680600571642.png
    193.3 KB · Views: 52
"Market Update: US Index Negative, Major Currencies Mixed, Precious Metals Higher, Asian Markets Down, Oil Flat, and US Dollar Index Rises"


Risk sentiment remains fragile as skittish investors fret about a recession after a slew of economic data through the week points to a cooling U.S. economy.
Over in the U.S., Tuesday's JOLTS report showed that job openings dropped to their lowest level in nearly two years in February. This followed data showing that the U.S. manufacturing sector sank deeper into contraction in March.
European equity futures and Asian shares slipped as concerns persisted over the path of global monetary policy and the health of US banks. New Zealand’s dollar rallied and the nation’s stocks retreated after the central bank raised interest rates by more than expected.
The Reserve Bank of New Zealand undertook such a move earlier Wednesday, raising interest rates by 50 basis points, more than expected, citing overheated inflation.

MSCI Inc.’s Asia benchmark was set to end a six-day winning streak, with almost all sectors in the red Wednesday. Futures for US equities were little changed after posting small gains earlier. The S&P 500 had dropped on Tuesday, dragged down by shares of financial heavyweights.

Banks came under renewed pressure Tuesday, with a gauge of financial heavyweights in the US falling the most in almost two weeks. In a wide-ranging annual letter to shareholders, JPMorgan Chase & Co.’s chief Jamie Dimon warned the US banking crisis that sent markets careening last month will be felt for years.

EURUSD

Fundamental Outlook:
German factory orders will draw interest early in the session. Following the trade data from Tuesday, the numbers will need to impress. Economists forecast a 0.3% increase in February.

Later in the session, euro area member states and the Eurozone service and composite PMI numbers will also influence. Spain, Italy, and the Eurozone’s PMI numbers will likely garner the most interest. Investors should also consider ECB member speeches, with the economic calendar on the busier side. ECB Chief Economist Philip Lane will lecture at the University of Cyprus today.

Technical Analysis: The currency pair has continued to maintain its bullish momentum after breaking through the 1.0917 level, which had been holding steady since last week. This indicates that there may be further price advances, with the next significant resistance level being the 1.1020 level from the second week of February. However, this level may present a challenge for the pair, as it touches the 100MA solid level from the weekly chart.

On the support side, the 1.0917 level is expected to serve as a new solid support level in case of a retracement. Further down, the 1.0850 level represents a confluence point of the down parallel of the bullish channel and the 200MA, and may also provide support for the price.

Support: 1.0920 – 1.0860 – 1.0800
Resistance: 1.1020 – 1.1084 – 1.1185
1680684205181.png


GBPUSD
Fundamental Outlook:
The British pound crashed to a record low last fall as investors rebelled against budget plans by former Prime Minister Liz Truss. Now, it’s enjoying a comeback.

The UK currency has been boosted by indications the country’s economy is holding up better than expected. Activity is now thought to have expanded 0.1% in the final three months of last year, up from a previous estimate of no growth at all. Gross domestic product growth in January has been estimated at 0.3% after dropping 0.5% in December.

Technical Analysis: According to today's technical analysis, there is a suggestion that the British pound may continue its upward trend as it breaks through the 1.2430 level, which has been held since last December. This movement is due to the weakness of the dollar. The next level of resistance for the pound is at the round number of 1.2500, followed by 1.2550 and 1.2600.

In terms of support, the first level is at 1.2480, followed by the stronger level of 1.2430. The lower parallel of the channel is expected to provide support, along with the 100MA acting as a strong level of support.

Support: 1.2480 – 1.2430 – 1.2350
Resistance: 1.2500 – 1.2550 – 1.2600
1680684230153.png


USDJPY
Fundamental Outlook:
Traders are betting that the biggest wage hike in decades won by Japanese unions amid historic inflation levels could prompt the Bank of Japan to undo massive stimulus, which would lift the yen from a three-decade low reached in October. Still others believe that the Japanese economy is not strong enough for the Bank of Japan to move toward policy normalization. The Bank of Japan's quarterly data on Monday showed that confidence among the country's top manufacturers has deteriorated for five consecutive quarters.

Technical Analysis: Based on the current technical analysis, the currency pair has retraced after reaching the 133.75 level and breaking the 131.70 support level. The next level of support is expected at 131.00, followed by the strong level of 130.00 from March 24th. If the 130.00 level holds as a strong support, the USDJPY may enter a price range.

On the other hand, resistance levels for the currency pair are expected at 131.70 initially, followed by 132.40, and ultimately, the 133.75 level.

Support: 131.00 – 130.00 – 129.00
Resistance: 131.70 – 132.40 – 133.75
1680684259692.png


XAUUSD
Fundamental Outlook:
Gold jumped to a 13-month high overnight after the US Dollar sunk along with Treasury yields. The benchmark 2-year note touched 3.82%.

Gold may have been boosted by US real yields sliding lower with the 10-year gauge dipping under 1.10%, a long way from the 1.72% seen just last month. The US Dollar appeared to be undermined by weak factory orders and jobs data.

Technical Analysis: Based on the latest technical analysis, gold prices have broken through the psychological level of 2000, confirming its status as a safe-haven asset, especially with the recent drop in yields. The current momentum may continue towards the next resistance level at 2030, followed by the highest level in March 2022 at 2050, and ultimately, the 2075 level. A break beyond these levels could lead to new record highs for gold prices.

In terms of support, the first level is expected at 2020, followed directly by the strong 2000 level, which was recently broken. These levels may provide some support for the price in case of a downturn.
Support: 2020 – 2000 – 1985
Resistance: 2030 – 2050 – 2075

1680684299421.png


UKOIL
Fundamental Outlook:
Oil prices climbed on Wednesday over rebounding demand in the US after data revealed that US crude stockpiles decreased by more than anticipated, coupled with supply side concerns driven by the recent output cut decision by OPEC and other oil-producing countries.

Late Tuesday, the American Petroleum Institute (API) announced an estimated decrease of 4.3 million barrels in US crude oil inventories, more than the market expectation of a 1.8-million-barrel draw.

A strong inventory decrease implies an uptick in crude demand in the US, easing market worries over falling demand.

Technical Analysis: Based on the latest technical analysis, Brent oil has experienced a significant increase in price and is currently trading in a narrow range between 86.00 and 83.00. Market participants are waiting for today's data releases for any potential market-moving developments. The strong resistance level of 86.5 remains in place and could pose a significant hurdle for the price to overcome. If it is breached, the next resistance level to watch is the 88.0 level from January 23rd. On the other hand, the current support level is at 84.0, which represents the lower end of the current trading range. A break below this level could push the price towards the 83.0 level, followed by the 81.0 level.

Support:83.00 – 81.00 – 80.00
Resistance: 86.5 – 88.00 – 89.00

Support:83.00 – 81.00 – 80.00
Resistance: 86.5 – 88.00 – 89.00

1680684340125.png


European and Asian Stock Markets Slide on Recession Fears Ahead of Easter Break


benchmark indices in China, Japan, South Korea, and Australia recorded a decline. Additionally, contracts for US shares fell following the 0.3% retreat of the S&P 500 on Wednesday, as selling pressure was concentrated in vulnerable segments of the market. The Nasdaq 100 also recorded a drop of 1%, which eroded the gains made during the index's excellent first quarter, during which it rose by a fifth.


The release of weaker-than-expected economic data in the U.S. has fueled concerns among investors about a possible recession. The Institute for Supply Management’s index dropped to a three-month low of 51.2, below the consensus estimates, and ADP's private payrolls data also failed to meet expectations, dampening risk appetite. Traders are awaiting the release of the non-farm payrolls data on Friday.

Although European equities had a strong start to the year, sentiment appears to be weakening due to concerns that a cooling U.S. economy could have a global impact.

The Eurozone economy showed its fastest expansion since May in March, according to final PMI estimates from S&P Global. However, given the tightening of credit conditions in the region that began before last month’s banking issues, this growth is not expected to last.

Haven assets continued to remain strong, with slight increases in two-year and 10-year Treasuries keeping yields close to their lows for the year. Government bonds also rose in Australia and New Zealand, with 10-year yields declining by around eight basis points.

EURUSD

Following Tuesday breakout at around 1.0917, EURUSD experienced a correction after the release of the ISM Non-manufacturing PMI, leading the price towards 1.0886. This level is currently playing the role of a potential neck in a head and shoulders pattern, though it is not strong enough to be confirmed at present.

When the European Central Bank convenes in May, it is widely anticipated to continue its efforts to combat inflation, which remains at elevated levels, by raising interest rates.

During a Wednesday interview, ECB chief economist Philip Lane observed that the inflation pressure is perhaps most intense in the food sector, and that it is currently still increasing. He added that, although we have not yet reached the peak of food inflation, projections indicate a decline later in the year.

Today's Initial Jobless Claims data may confirm continued contraction in the labor market, which has remained tight for the past two years. This data is being closely watched ahead of Friday's release of the non-farm payroll report.

Although there was a minor correction in the bullish trend yesterday, the trend still appears to be intact. Additionally, the decline in DXY, which rejected the 102.05-point resistance and is currently trending downwards, may not continue.
Support: 1.0880– 1.0860 – 1.0800
Resistance: 1.0940 – 1.0970 – 1.1020
1680772892366.png


GBPUSD

During the first quarter of 2023, the pound experienced a robust start and surpassed all of its significant counterparts, owing to a string of economic data that exceeded analyst expectations. The increase in interest rates at the Bank of England, as well as the institution's continued data-driven approach towards policy changes, also contributed to the pound's rally.

The general bullish trend appears to have encountered a fresh obstacle due to the strong dollar seen yesterday around the 1.2500 level. Despite the minor correction that followed, the trend is expected to continue towards the 1.2600 level, and potentially the 30 May 2022 level of 1.2700 thereafter.

In terms of support levels, the 1.2440 level is the first to watch, followed by the round number of 1.2400. The median line of the Bullish channel may also play a supportive role around the 1.2380 level.

Support: 1.2440 – 1.2400 – 1.2380
Resistance: 1.2500 – 1.2600 – 1.2700
1680772920022.png


USDJPY


Amidst the global economic recession concerns and the investors' rush towards safe-haven currencies such as USD and CHF, JPY has experienced a boost. The fall in the G10 Economic Surprise Index has further exacerbated fears of a possible slowdown in the global economy, thereby benefiting JPY.

USDJPY is currently trapped in a price range of 133.75 and 130, with a potential support level of 130.50, followed by 130.00. On the resistance side, the levels of 131.70 and 132.38 come into play.
Support: 131.00 – 130.00 – 129.00
Resistance: 131.70 – 132.40 – 133.75
1680772948716.png


XAUUSD


Gold prices retraced from their one-year highs as the dollar regained some strength, while investors eagerly anticipate the release of the U.S. non-farm payrolls report to gain insight into the Federal Reserve's monetary policy decision which markets are pricing 58.5% chance Fed stop the increase in May. Despite the pullback, the macroeconomic environment remains supportive of gold as a hedge during inflationary times, given the concerns of an economic slowdown and the implementation of interest rate hikes to address inflation worldwide, Gold retraced to the 2012 level after reaching a high of 2030 in March 2022, which is a normal occurrence given the pace of the bullish trend formation. The solid resistance level of 2050/70 remains within reach.

Support: 2020 – 2000 – 1985
Resistance: 2030 – 2050 – 2075
1680772990582.png


UKOIL


The Brent price action remains stagnant within a narrow range of 84.00 to 86.00, following the surge from 80.00 last weekend after OPEC+ surprisingly announced a production cut of 1.16 million bpd. The looming concerns of a US recession and global growth prospects may potentially restrict the price at these levels.

The resistance level of 86.00 holds as a significant historical resistance level from the beginning of the year. A potential breakout of this level could lead to a rise towards 86.5, followed by 88.00. On the other hand, the 83.5 level will be the first test for Brent, followed by 81.00 and 80.00 as crucial support levels.
Support:83.00 – 81.00 – 80.00
Resistance: 86.5 – 88.00 – 89.00

1680773015518.png
 
"US Labor Market Faces Slowdown as Fed Tightening Nears End; Equity Futures Remain Stable Ahead of Key Jobs Report"
While several Asian countries, including Australia, Hong Kong, and Singapore, are closed for holidays, financial markets in Japan and mainland China remained open. The benchmark Topix in Japan showed signs of improvement, edging higher and ending a two-day slump. Additionally, shares in China and South Korea saw gains. However, most European markets are currently shuttered.

US equity markets will be closed on Friday, but traders will still have their eyes on the government's payroll report for hints on the Federal Reserve's future policy moves. Stock futures, however, will continue trading throughout the Asian and European sessions and will only close at 9:15 a.m. in New York, approximately 45 minutes after the release of the jobs data.

On Thursday, data was released showing that jobless claims filings had exceeded estimates for the previous week. This came after a private payrolls report had indicated that hiring had slowed more than forecast.

The Non-Farm Payrolls (NFP) report has exceeded expectations for the past 11 months, an impressive streak indeed. Economists are anticipating another relatively robust increase of 240,000 jobs in March 2023, thanks to these continuous upside surprises. Although this figure falls short of last month's 311,000, it would still be higher than the pre-pandemic average of just under 200,000.

According to experts, labor shortages in specific service industries are still contributing to the tight jobs market. The latest US Services PMI report from S&P Global revealed that "firms noted further difficulties finding skilled candidates." While February's ISM Services PMI stated that the employment picture had improved for some industries despite the tight labor market, it also noted that several industries reported continued downsizing.

EURUSD
Despite facing strong resistance, the EUR/USD pair managed to hold above 1.0880 and even climbed to 1.0940, signaling a bullish outlook. However, momentum appears to be fading, and the pair still faces significant resistance ahead. The daily chart shows the Euro holding firm above key Simple Moving Averages (SMA), which indicates a bullish stance, and traders are eyeing the 1.1000 level as the next target.

The long-term view still bullish and the higher highs movements still consistent indicating more advancement in price can happen if Data confirms

Germany reported a 2% rise in Industrial Production in February on Thursday, following the 4.8% surge in Factory Orders released on Wednesday. In the US, the data showed that the Initial Jobless Claims had decreased to 228,000 after seasonal adjustments, indicating a softer labor market.
The upcoming NFP data on Friday is of great significance and is the only market driver until Tuesday. The general consensus is that March will see an increase of 240,000 jobs, with the unemployment rate staying at 3.6%. This has led to a decrease in expectations for another rate hike from the Federal Reserve (Fed) at the next meeting. The employment numbers are expected to have a significant impact on bonds, the US Dollar, and the equity market.

Support: 1.0880– 1.0860 – 1.0800
Resistance: 1.0940 – 1.0970 – 1.1020

1680860853764.png


GBPUSD
The GBP/USD pair has found stability above the mid-1.2400s, despite facing rejection near 1.2500 on Wednesday. Buoyed by optimistic expectations from the Bank of England (BoE), but is also exhibiting a tentative outlook ahead of the crucial US Nonfarm Payrolls (NFP) release. The current near-term technical analysis of the pair shows that the bullish sentiment remains strong. However, if the price drops below 1.2440, it may trigger an extended downward correction.

Andrew Goodwin, the Chief UK Economist at Oxford Economics, forecasts that the Bank of England (BoE) will implement another 0.25% rate hike due to the ongoing inflation pressure, as the central bank is informally referred to as the "Old Lady."

As of early Thursday, it was reported that UK Halifax House Prices rose by 0.8% on a monthly basis in March, surpassing market expectations for a decline of 0.3% and briefly supporting the Pound Sterling. The Bank of England's Monthly Decision Maker Panel also showed a decline in the year-ahead inflation expectation, dropping from 5.9% in February to 5.8% in their latest report.

Support: 1.2440 – 1.2400 – 1.2380
Resistance: 1.2500 – 1.2600 – 1.2700


1680860882252.png


USDJPY

USD/JPY lacks clear direction as the Good Friday holiday outside Japan combines with mixed factors at home, and a cautious sentiment ahead of the key US data, challenging momentum traders. Earlier in the day, Japan reported an improvement in inflation-adjusted prices of household spending for February, as well as higher figures for Overall Household Spending and Labor Cash Earnings. However, the actual figures still suggest a contraction in spending, prompting the Bank of Japan (BoJ) to maintain its easy-money policy. The recent firmer data and hopes for the BoJ's exit from the policy have also led the central bank to purchase more bonds, resulting in a record holding of Japanese Government Bonds (JGBs) in March. At his retirement news conference on Friday, outgoing BoJ Governor Haruhiko Kuroda mentioned a "broadening trend" where inflation is reflected in wages.
The range of 133.75-130.00 still holding as the price movements still bearish on the 1H chart showing a downtrend movement holding at the round number 132.00 with the 100MA as resistance for the last correction leg. The 130.5/130 could be the next support for the down trend if it continues.

Support: 131.00 – 130.00 – 129.00
Resistance: 131.70 – 132.40 – 133.75
1680860917541.png


XAUUSD

Gold prices retraced from their one-year highs as the dollar regained some strength, while investors eagerly anticipate the release of the U.S. non-farm payrolls report to gain insight into the Federal Reserve's monetary policy decision which markets are pricing 58.5% chance Fed stop the increase in May. Despite the pullback, the macroeconomic environment remains supportive of gold as a hedge during inflationary times, given the concerns of an economic slowdown and the implementation of interest rate hikes to address inflation worldwide, Gold retraced to the 2012 level after reaching a high of 2030 in March 2022, which is a normal occurrence given the pace of the bullish trend formation. The solid resistance level of 2050/70 remains within reach.

The technical outlook for gold price remains unchanged, with strong support at the $2,000 mark and the next big resistance at 2050/70 if prices continue to rise. If the $2,000 resistance level is broken, support will be found at 1985. The direction of Gold price is currently dependent on the upcoming United States labor market report, which will be the final employment data that the Federal Reserve assesses ahead of their May 2 and 3 monetary policy meeting. A miss on the Nonfarm Payrolls number combined with softening wage inflation in the US would build a strong case for a Fed rate hike pause in May, leading to a drop in the US Dollar and US Treasury bond yields and pushing the Gold price back towards the yearly high of $2,032. However, if the Nonfarm Payrolls figure surprises to the upside, bets on a 25-basis points Fed rate hike will strengthen, leading to a resumption of the Gold price correction below $2,000.
Support: 2020 – 2000 – 1985
Resistance: 2030 – 2050 – 2075
1680860955974.png


UKOIL


Brent crude oil continues to trade around 85.00, maintaining its three-week uptrend while energy markets remain positive during the Good Friday holiday. The price rise has been supported by the surprise output cut announced by OPEC and its allies, OPEC+, at the start of the week. However, concerns about a possible recession and the upcoming US employment report for March have created some caution in the market. Additionally, optimistic economic growth projections and upbeat activity data from China are also providing support to the oil price. Despite these positive factors, the recent calls for a recession are challenging Brent oil buyers, and further clues of an economic slowdown should be closely monitored.

The price range of the USD/JPY pair is still tight, with 86 acting as resistance and 84.00 as support. If there is a bullish breakout, the pair will encounter resistance at the confluence point of 86.5, which has been a strong historical level since the beginning of the year. On the other hand, if there is a sell-off, the huge gap will be filled quickly and the support level of 80, backed by the 200 MA on the 4H chart, will be crucial to watch.
Support:83.00 – 81.00 – 80.00
Resistance: 86.5 – 88.00 – 89.00


1680860984777.png
 
"Markets Weighing the Odds of Fed Rate Rise as Asian Shares and Yen React"

Last week's US nonfarm payroll report served as a reminder to the markets that the Federal Reserve's fight against inflation is far from over. According to data from the US Labor Department, nonfarm payrolls rose by 236,000 jobs in March, slightly below the 239,000 expected by economists in a Reuters poll. However, annual wage gains, although slowing, remained high and inconsistent with the Fed's 2% inflation target. As a result, Fed futures are now pricing in a greater likelihood of a 25bps rate hike in May. Although last week saw equities close higher thanks to a tech-led rally, futures at the start of this week are mixed, with thin liquidity supporting the markets as many participants are still away on Easter holiday.

After the release of the jobs report, the benchmark 10-year US Treasury bond yield rose by nearly 3% in the shortened session, ending a seven-day losing streak. As a result, the US Dollar Index (DXY) saw modest gains for the day. As of early Monday, the DXY remains comfortably above 102.00, but the 10-year US yield remains in negative territory at around 3.35%. In the meantime, US stock index futures are trading mixed ahead of the reopening of Wall Street after the long weekend.

EURUSD


In mid-April, the euro was trading around $1.09, near its two-month high of $1.0973 reached earlier in the month. The European Central Bank's (ECB) plan to raise interest rates to combat inflation supported the currency. However, there seems to be some uncertainty among ECB members regarding the rate hike. While ECB chief economist Philip Lane expressed the need for a rate hike in May, ECB member Klaas Knot is unsure if a 50-bps increase is necessary or if a 25-bps cutback is possible. The market is anticipating a 25 bps increase in the 3% deposit rate on May 4th, with another 25-bps move expected by mid-year.

Meanwhile, investors are also closely watching the US labor market, as the latest non-farm payroll report indicated a tight labor market and reinforced expectations of a 25-bps rate hike by the Federal Reserve in May.

The EUR/USD currency pair has formed a bearish descending triangle with support at the 1.0885 level. While the long-term bullish trend remains intact, the upcoming data releases from the US and EU this week could potentially break the price level either upwards or downwards. The next resistance levels for the pair are at 1.0940 and 1.0970, while support levels remain at 1.0885 and 1.0850.

Support: 1.0880– 1.0860 – 1.0800
Resistance: 1.0940 – 1.0970 – 1.1020
1681120020313.png


GBPUSD


The British pound steadied around $1.24 in April, having touched a high of $1.2525 on April 4th. This is due to the market's belief that the Bank of England will continue to raise interest rates to combat inflation. In addition, a stronger-than-expected economy has also provided some support, aided by falling energy prices. However, last week, Chief Economist Huw Pill stated that the central bank could not be certain that it has raised interest rates enough to control inflation. This comes after data showed that UK inflation unexpectedly rose to 10.4% in February, and food inflation reached a record high in March.

The British pound witnessed a temporary pause in its downtrend on the 1-hour chart, with support seen at 1.2420. However, this trend may be short-lived, especially after the positive impact of Friday's NFP numbers on the US dollar. If the pound manages to break out on the upside, it may face resistance at 1.2470 and 1.2520, which is the last resistance level.

Support: 1.2400 – 1.2380 – 1.2340
Resistance: 1.2435 – 1.2470 – 1.2520
1681120040271.png
 
"Global Markets on the Rise: Stocks, Futures, and Yields Gain Traction while Dollar Weakens"
Investors returned to work on Tuesday following a long Easter break, with European shares rising. Germany's DAX 40 surged by approximately 0.7% to reach its highest level since January 2022. The start of the earnings season this week and March's US inflation report due on Wednesday were also in investors' sights. In addition, traders have analyzed the recent US jobs report, which indicates a still-tight labor market, cementing expectations of a 25-bps rate hike by the Federal Reserve in May.
US dollar surged significantly as US yields increased, which could be partly due to a delayed reaction to the resilient but mixed US jobs and earnings data from the previous Friday, which was a banking holiday. However, the primary reason for the USD's strength was the USDJPY buying after the new Bank of Japan governor, Ueda, affirmed the continuity of BoJ policy.

S&P 500 eked out a gain in the final minutes of the session after spending most of the day in the red. The Nasdaq 100 pared losses into the close, ending marginally lower as an Apple Inc. report that personal computer shipments fell sharply weighed on the tech-heavy benchmark.
Following the dovish stance of the new Bank of Japan governor, Kazuo Ueda, Japanese shares climbed, and there was also a report that Warren Buffett is shifting his focus back to Japan. Ueda indicated that any significant changes to monetary policy are unlikely at this time. The Nikkei news outlet reported that Buffett is seeking to expand his exposure to Japanese stocks.

Markets are pricing for a strong likelihood the Federal Reserve will hike interest rates by a quarter-point May 3 to contain inflation. That’s in contrast to Asian central banks that are starting to pause. It’s also a stark turnaround from March 22 when the Fed set its policy band at 4.75%-5% and the odds of a May rate hike almost vanished amid the turmoil in the banking sector.
On Monday, the International Monetary Fund released a report proposing that rates in the US and other industrial countries will trend back towards ultra-low levels instead of the 1.5% to 2% real neutral interest rate previously suggested by former US Treasury Secretary Lawrence Summers.
After the release of a robust employment report last Friday, investors increased the probability of a 25-basis point rate hike at the May FOMC meeting and raised it to 80%. Additionally, the upcoming USD90 billion refunding auctions from Tuesday to Thursday contributed to a decline in Treasury prices. Yields across the curve rose by 2-3 basis points, with the 2-year yield surpassing the 4% mark to reach 4.01%, while the 10-year yield climbed to 3.42%.
As March's banking turbulence receded and investors became increasingly optimistic about US central bank monetary policy, Bitcoin (BTC) surpassed the $30,000 level for the first time since June 10, 2022. The cryptocurrency with the largest market capitalization was trading at $30,237, reflecting a 6.75% increase over the previous 24 hours.

EURUSD

On Easter Monday, the EUR/USD pair decreased following Friday's NFP report, with the US dollar strengthening across the board. The pair hit a week-long low of 1.0830 before recovering to 1.0850 amid an improvement in market sentiment. Market participants have turned their attention to Wednesday's US Consumer Price Index figures.

After the optimistic March jobs report, the Greenback opened the week stronger, leading to an increase in the expectations of another rate hike from the Federal Reserve (Fed). On Monday, US yields rose, with the 2-year yield surpassing 4% and the 10-year yield above 3.40%.


EUR/USD is currently experiencing a downward correction, although the overall trend remains bullish. In the short term, the pair is forming a downward channel, but the price is still above important moving averages in the daily chart. A potential sign that the correction is over would be a recovery above 1.0910.

On the 4-hour chart, the 100-period moving average coincides with the lower boundary of the long-term bullish channel, providing support. Meanwhile, the rebound needs to surpass the 1.0910 level on the 1-hour chart to confirm the end of the recent bearish trend and the continuation of the longer-term bullish trend.

Support: 1.0880– 1.0860 – 1.0800
Resistance: 1.0940 – 1.0970 – 1.1020

1681206647503.png


GBPUSD1681206647503.png1681206821240.png1681206851285.png1681206886343.png1681206929891.png
 
Markets Brace for U.S. Inflation Data Amid Fed Uncertainty
European equities recorded modest gains on Tuesday after the long Easter weekend, with a muted opening expected on Wednesday. However, investors are cautiously waiting for the U.S. CPI index for March to be released to assess the likely response from the Federal Reserve as well as gauge the stickiness of prices.

According to Bloomberg estimates, March's CPI is expected to slow down to 5.2% from February's annual gain of 6%. Although it would be the slowest increase in consumer prices since May 2021, it would still be significantly above the Federal Reserve's 2% target. On a "core" basis, prices are expected to have risen 0.4% over the previous month and 5.6% over the previous year in March.

The Fed risks sending the economy into a recession by hiking rates too high too fast Later in the day, the minutes of the Fed's last meeting in March, where it raised rates by 25 basis points and hinted that it may be at the end of its hiking cycle, are also due. Investors will scrutinize the commentary to better comprehend the Fed's thinking about the banking sector turmoil, which had raised expectations of rate cuts. On Tuesday, Philadelphia Federal Reserve Bank President Patrick Harker reiterated that the central bank is committed to bringing inflation down from its elevated levels, adding that he feels the Fed may soon be done raising interest rates.

EURUSD
Boosted by a weaker US Dollar, the pair climbed above 1.0900 and beyond ahead of crucial US economic data and amid expectations of another interest rate hike from the European Central Bank (ECB).


Tuesday's release of Eurozone Retail Sales data showed a drop of 0.8% in March as expected, and the annual rate worsened to -3% from -1.8%, but it beat the consensus of -3.5%. The next important report for the region will be on Thursday with Industrial Production. Expectations of a 25-basis point rate hike at the May 4 meeting have been fueled by the ECB's tightening stance. Federal Reserve's Goolsbee mentioned the need to assess the potential impact of financial stress on the real economy while Williams said that they would have to lower interest rates if inflation comes down. Despite the rise in US yields, the US Dollar remained weak due to an improvement in risk sentiment. All eyes are now on the release of the March US Consumer Price Index on Wednesday, which is expected to show a 0.3% rise in CPI and a 0.4% increase in Core on a monthly basis. Later in the day, the Fed will publish the minutes of the latest FOMC meeting

The EUR/USD rallied on Tuesday, reaching a high of 1.0927 before retracing slightly to find support above 1.0900. The immediate resistance level is at 1.0935, with a potential target of 1.0940. A break above this could see the pair testing the monthly high at 1.0970, and potentially even reaching the key psychological level of 1.1000. On the 4-hour chart, the Euro has immediate support at 1.0895, with further support at 1.0885 and 1.0860 below that. Despite recent losses, the daily chart still shows an overall bullish bias, with a break above 1.1000 needed to confirm this on the weekly chart where the 100MA is providing resistance at the same level.

Support: 1.0900– 1.0885 – 1.0860
Resistance: 1.0935 – 1.0970 – 1.1000
1681294562881.png


GBPUSD


The GBP/USD is holding onto modest gains, with upside momentum capped just below 1.2450 during early European trading. Traders are eagerly anticipating the US inflation data and FOMC Minutes for fresh USD valuations, as the Greenback remains on the back foot amid expectations of soft CPI figures. Meanwhile, investors are keenly awaiting guidance from BOE Governor Bailey's speech in Washington, with markets anticipating a 25bps hike at the upcoming BOE meeting. However, with other major central banks pausing their hiking cycles and weak economic growth forecasted for the UK, there is a chance that the BOE may follow suit. If GBP/USD continues to climb above 1.2420, the pair's next resistance levels will be at 1.2450 and 1.2470, with interim hurdles at 1.2500 and 1.2525/1.2530. However, if GBP/USD falls below 1.2420 and starts using that level as resistance, additional losses could lead to 1.2400 and 1.2375.
Support: 1.2400 – 1.2375 – 1.2280
Resistance: 1.2450 – 1.2470 – 1.2500

1681294607009.png
 

Attachments

  • 1681294693203.png
    1681294693203.png
    110.3 KB · Views: 57
  • 1681294657789.png
    1681294657789.png
    141.2 KB · Views: 44
Inflation cools down and FOMC minutes signal a recession later this year.
On Thursday, a majority of Asian stock markets experienced a decline, mirroring the previous day's drop on Wall Street. Investors are increasingly apprehensive about a possible U.S. recession, given the underwhelming inflation data and the expectation that the Federal Reserve may temporarily halt its interest rate hikes.
Despite a positive start to the day, with the release of the CPI figures showing a slowdown in inflation levels, the American stock market ended in the red yesterday following the release of the FOMC minutes. The minutes indicated that the economy's slowdown would mostly lead to a recession later in the year, especially with the current tighter credit conditions.
Consumer price inflation decelerated in March, with the consumer price index registering a modest 0.1% increase for the month, or a 5% year-over-year rise, both of which were lower than anticipated by 0.1 percentage points. However, the core CPI, which excludes the volatile food and energy components, remained persistently elevated at 5.6%.

EURUSD
The release of weaker-than-expected inflation data on Wednesday has led the market to price in a single hike by the Fed in May, with a potential rate cut later in the year. This is due to the FOMC minutes indicating an upcoming recession, as well as the fallout from the last month's events in two large regional banks and the current tight credit conditions.
As the market anticipates more rate hikes from the ECB, there may be a divergence between the policies of the Fed and the ECB, potentially giving the EUR an advantage against the USD.
The DXY has experienced a significant selloff after recent events, breaking its support level of 101.4 and forming a strong bearish channel on the daily chart. Strong support may be found at 100.3 and the 100MA. Meanwhile, the EURUSD is challenging the 1.10 level on the daily chart in an attempt to break out and confirm on the weekly chart that prices are above the 100MA. The current price action is supported by fundamentals and sentiment, indicating that the EURUSD may continue its bullish stance.

Potential resistance levels for the EURUSD are at 1.1160 and 1.1200, while support levels are at 1.0960 and 1.0900.
Support: 1.0960– 1.9000 – 1.0880 Resistance: 1.1000 – 1.1160 – 1.1200
1681380735971.png


GBPUSD

The GBP/USD continues to maintain its bullish momentum, with negative inflation data from the US contributing to the GBP making new higher highs. While the UK economy flattened in February due to strikes in the public sector, this had little impact on the GBPUSD as macroeconomic data for the UK showed a better-than-expected outlook.

The current price action suggests a clear and strong bullish momentum, indicating a possible breakout of the last resistance level of 1.2500 and a first resistance level around 1.2600 and 1.2660. In case of a correction, the 1.2480 level will serve as the first support followed by 1.2450.

On the daily and weekly charts, the GBPUSD shows a healthy bullish trend after the GBP had collapsed to its lowest level in 40 years, with political tensions destabilizing trust in the UK bond market.

Support: 1.2480 – 1.22450 – 1.2280
Resistance: 1.2500 – 1.2550 – 1.2400
1681380760961.png


USDJPY

The USD/JPY pair remains under pressure as the market expects the Federal Reserve to pause its rate-hiking cycle and the looming risk of a recession benefits the safe-haven Japanese Yen. The International Monetary Fund also trimmed its 2023 global growth outlook, citing the impact of higher interest rates. However, the dovish outlook of the Bank of Japan is limiting losses for the USD/JPY pair. The new BoJ Governor, Kazuo Ueda, recently stated that it was appropriate to maintain the ultra-loose stance as inflation has yet to hit 2% as a trend.

The USD/JPY pair remains range-bound between support at 130 and resistance at 133.8 on the 4-hour chart. Currently, the pair is testing resistance at 133.8 after the release of Data from US the pair reversed gooing back to its first support at 133.00. helped by the dollar weakness the pair may continue the slide down toward the next support at 132.00 and followed by 130.80. The resistance level stay the 133.750 as range top line.
Support: 131.00 – 130.00 – 129.00
Resistance: 131.70 – 132.40 – 133.75
1681380788059.png
 
Stocks on the rise and Dollar sinking on Peak-Rate Bets

Asian stock markets finished higher after declining inflation data changed market expectations towards a pause of interest rates hikes from central banks around the world. This was confirmed by the Singapore Monetary Authority, which announced it would pause future interest rate hikes at the actual level.

European stock markets are expected to open higher, following positive closes in the US and Asia, as a result of yesterday's US PPI data giving more confidence that the inflationary wave is cooling. This may lead the Federal Reserve to make a final rate hike in May and pause thereafter. In March, the Producer Price Index declined by 0.5% on a monthly basis, bringing annual inflation down to 2.7%.
The swap market still expects a 0.25% hike in the next Federal Reserve meeting as a final hike towards a terminal rate of 5-5.25%, followed by a pausing period and a later cut, which would bring rates down to 4.25-4.5% by the end of the year. This projection came as a result of deteriorating economic conditions confirmed by the projections in the last FOMC minutes report, indicating a mild recession later this year and fallout of two regional banks last month in very tight credit conditions.
Today's retail sales data should confirm yesterday's PPI numbers and the general sentiment towards declining inflation rates and pressures, which may help contribute to another green day in the stock markets and a continued decline in the US dollar index, trading at its lowest levels since the start of the year.
Later in the day, U.S. stock markets are set to open as investors eagerly anticipate the start of earnings season. JPMorgan, Wells Fargo, and Citi are among the companies publishing their results, which investors will be closely watching.

EURUSD
The EUR/USD recorded its highest daily close since March 2022, marking its third consecutive daily gain on Thursday. The pair is striving for new higher levels of equilibrium as the rally continues, driven mainly by a weakening Dollar, and also by a stronger Euro.

The contrast between the outlooks of the Federal Reserve and the European Central Bank is reflected in the market pricing for future cuts and hikes. While the market has priced in another 50 basis points of hikes by the European Central Bank with no easing this year, the odds that the Fed may raise interest rates for the last time in May or stay on hold have increased following US data. The Producer Price Index (PPI) fell 0.5% in March, against expectations of a flat reading, while the Core PPI dropped 0.1%. Another report showed that Initial Jobless Claims for the week ended April 8 came in higher than expected, marking the highest level in months. More US economic data is due on Friday, including Retail Sales and Industrial Production.

The spread between U.S. 10-year yields and German bunds has narrowed to its smallest in two years, at around 100 basis points, due to this divergence in outlooks.

Support: 1.1020– 1.0980 – 1.0960
Resistance: 1.1080 – 1.1160 – 1.1200


1681466703651.png


GBPUSD

The sustained selling around the US Dollar (USD) is fueling the ongoing positive momentum, with expectations that the Federal Reserve (Fed) is nearing the end of its rate-hiking cycle. The bets gained strength after the release of Thursday's data, which showed that US inflation at the wholesale level continued to decline rapidly in March. According to the US Bureau of Labor Statistics, the US Producer Price Index (PPI) slowed down significantly from the previous month's upwardly revised reading of 4.9%, registering a 2.7% YoY rate in March - the lowest level seen since January 2021.

From a technical perspective, the overnight sustained strength and close above the 1.2500 psychological mark could be seen as a fresh trigger for bullish traders. Next resistance target of 1.2600 will be the new challenge for the parity to reach, considering the continuation selling pressures On Dollar. A short correction may take the price back to the 1.2500 mark.

Support: 1.2500– 1.2470 – 1.2440
Resistance: 1.2550 – 1.2600 – 1.2660
1681466822816.png

USDJPY


The USD weakened against all major currencies following the release of the US Producer Price Index (PPI) data, contributing to the third consecutive day of losses for the USD/JPY pair. The softer-than-expected US Consumer Price Index (CPI) report on Wednesday coupled with the latest US PPI print, which indicates a smooth progress of disinflation and a possible acceleration, has strengthened expectations that the Fed will conclude its monetary tightening cycle after one final hike in May. These developments have weighed on the USD.

The USD/JPY pair is still respecting the range price around the 133.75 resistance line and 130.00 support level. Further sell-off may continue towards the 131.70 support level and next to the 131.00 round number price. The possibility of a short correction is present with 132.80 playing as a resistance level, followed by the 133.00 level.
Support: 132.00 – 131.00 – 129.00
Resistance: 132.80 – 133.00 – 133.75
1681466899683.png

XAUUSD


Gold surged to a new high of 2048 levels after the PPI data signaled a slowdown in inflation, aided by the broad-based Dollar selloff and bets on the Federal Reserve (Fed) reaching its peak rates by next May, as is the case for many central banks worldwide. A minor pullback towards the 2030/2029 level seems healthy for a potential continuation on the upside, given the data doesn't disappoint. Today's release of US Retail Sales for March and the Michigan Consumer Sentiment survey will confirm this week's data readings on inflation and economic conditions, which the market eagerly anticipates. Given the current economic macroenvironment and market sentiment, gold remains a must-have for investors, as yields drop with central banks easing their monetary policies, and market participants bet on a rate cut soon due to deteriorating economic conditions that may affect earnings, starting today.
Support: 2029 – 2022 – 2018
Resistance: 2045 – 2050 – 2075
1681467335218.png


UKOIL

Oil prices have been experiencing downward pressure due to uncertainty over both supply and demand since the start of the month. Brent crude is currently down by 0.3% to $85.88 a barrel. On the demand side, data coming from the US and the latest IMF growth projections are exerting pressure on oil prices. The FOMC minutes from the last meeting indicated a mild recession later this year, while Thursday's data revealed a slowdown in the US economy following increased jobless claims numbers. However, the rebounding Chinese economy suggests increased demand as China's March crude imports rose by +16% month-on-month to 12.37 million bpd, the highest level since June 2020. Regarding the supply side, the surprise cut of more than 1 million bpd by OPEC+ on Monday as a precautionary measure, which was explained by Saudi Arabia, is still helping to hold the price up. Additionally, the ongoing halt of Iraqi crude exports from Turkey is making more pressure on the supply, thereby helping prices to continue on the upward trend.
From a technical perspective, on the 4H chart, 87 is the first resistance level going back towards 85, which indicates that prices should finish the day on the daily chart beyond the 87 mark for a possible upward movement toward the next target of 88.

Support:85.00 – 84.00 – 83.50 Resistance: 87.00 – 88.00 – 89.00

1681467578061.png
 
Last edited:
The Chinese economy is recovering faster, while indices remain cautious ahead of today's earnings reports.

Hong Kong and Shanghai stocks surged as China is set to release data on Tuesday, which is expected to reveal an uptick in industrial production and retail sales, signaling a continued rebound from Covid-induced lockdowns. However, the People's Bank of China has opted to maintain a key lending rate and made the lowest net injection of liquidity since November.

The People's Bank of China (PBOC) kept its medium-term lending rate facility unchanged at 2.75%, maintaining a stable monetary policy as China awaits the release of a key Q1 GDP reading on Tuesday. Additionally, the upcoming industrial production and retail sales data are expected to provide further insights into the ongoing economic recovery. Later this week, the PBOC is also expected to announce its decision on the key loan prime rate.

European futures have inched higher this morning, buoyed by a hawkish comment from Federal Reserve officials, particularly Christopher Waller's speech on Friday, in which he called for more rate hikes. As a result, the market is now pricing in an 85% probability of a 0.25% rate hike in May.

Investors are also closely monitoring the release of the Fed's Beige Book later this week, along with comments from officials such as John Williams, Raphael Bostic, Loretta Mester, and Lisa Cook. These events could provide additional insights into the Fed's monetary policy outlook and potential interest rate moves.

EURUSD
The markets are pricing in a greater chance of another 25-bps lift-off at the next FOMC meeting in May. This is due to a rise in short-term inflation expectations, as shown by the University of Michigan’s preliminary report. The report also showed that the Consumer Sentiment Index inched up from 62.0 to 63.5 in April and one-year inflation expectations rose to 4.6% from 3.6% in March. These factors remain supportive of elevated US Treasury bond yields and continue to underpin the Greenback.
On Friday, Fed member Waller’s comments were very effective in changing odds toward more rates from The Fed at the next meetings against what the market was pricing for one last rate in May. As a result, the Dollar outperformed taking EURUSD for a correction toward last support making it new resistance.

Also, banking earnings from big banks on Friday eased concerns about banking fallout last month and gave more trust to the financial sector. A report from Fed last Friday showed deposits in different bank sizes are coming back to their normal conditions after the fear panic of the last month.
EURUSD recovered on Friday coming back toward the 1.0960 last resistance level to mark a new support. The long bullish trend still intact while the momentum seems solid. The pair made its correction and is forming a possible head and shoulders on the 1H chart with 1.1075 as the resistance level.

Support: 1.0960– 1.0930 – 1.0900 Resistance: 1.10100 – 1.1045 – 1.1075

1681725844846.png


GBPUSD
The dollar's recovery from Friday's trading, following comments from Fed members and the release of the University of Michigan Inflation expectation data, was aided by an increase in 1-year inflation expectations to 4.6% from 3.6% prior. This increase helped facilitate the correction and resulted in a shift in market sentiment and pricing for future Fed rates.

The Bank of England is contemplating a significant revamp of its deposit guarantee program, which involves increasing the coverage amount for businesses and requiring banks to pre-fund the system to a greater extent. This would ensure faster access to cash in the event of a lender's collapse. Based on technical analysis, it appears that the GBPUSD pair is forming a double top on the 4-hour chart. The current price is at the 100MA and parallel of the uptrend channel. If the pair breaks out of the parallel and the 100MA, it could trigger a new selloff towards 1.2350 and 1.2280, with the 200MA serving as a potential support level thereafter.

Support: 1.2390– 1.2350 – 1.2280 Resistance: 1.2420 – 1.2450 – 1.2480

1681725874559.png


USDJPY

Japan is due to release its inflation data on Friday, with core inflation for March expected to have softened on-year to 3.2% from 3.3% in February. However, this is still far from the Bank of Japan's 2% target. Ahead of the release, the USD/JPY pair seems to be in high demand as Japan's new central bank governor, Kazuo Ueda, emphasized at his inaugural press conference last week that there is no rush to change the ultra-accommodative policy settings, including yield curve control. Ueda stated that significant changes to YCC should be determined by examining economic, price, and financial trends, while also noting that the BOJ should avoid being too late in normalizing monetary policy and remain open to some adjustments sooner rather than later.

Following Friday's bullish movement in the dollar, the USD/JPY pair broke through the range of 133.50-130.00 to the upside, indicating the possibility of an upward continuation. The next resistance levels are at 134.7, followed by 135.7. On the support side, the pair could find support at the 133.40 and 138.8 levels.

Support: 132.00 – 131.00 – 129.00 Resistance: 132.80 – 133.00 – 133.75
1681725896394.png

XAUUSD


With markets exhibiting caution despite strong earnings reports from US banks. Investors are weighing the prospect of further US Federal Reserve (Fed) rate hikes amid concerns about a potential recession, following mixed US economic data and Fed commentary released on Friday. In March, US Retail Sales fell by 1.0% MoM, missing estimates of -0.4%, while Core Retail Sales declined by 0.8% MoM, also below expectations of -0.3%. On the other hand, Industrial Production rose by 0.4% MoM in March, surpassing the expected increase of 0.2%, and the University of Michigan (UoM) Consumer Sentiment rose to 63.5 in April, above the forecasted 62.0. However, the UoM five-year Consumer Inflation Expectations remained at 2.9% in April.

The latest comments from Federal Reserve policymakers have played down expectations of a significant number of rate cuts. Atlanta Fed President Raphael Bostic indicated that recent developments are consistent with the possibility of one more rate hike. Fed Governor Christopher Waller stated that recent data shows that the Fed has not made significant progress towards its inflation goal, suggesting that rates need to rise further. Chicago Fed President Austan Goolsbee warned that a mild recession in the US is a possibility.

Gold retraced to the 2000 level on the 100MA on the 4H chart Continuing confirming that long term Bullish trend still solid. The correction on Friday could be temporary as Gold can came back to its last resistance on the 2050 and next 2070 historical resistance level

Support: 2000 –1987 – 1970 Resistance: 2011 – 2020 – 2032
1681725921205.png

UKOIL

The outlook for crude oil prices is mixed, leaving traders uncertain about the direction of the market. Brent crude oil remains steady at $86.31 a barrel. Despite expectations of a tighter market, concerns about demand persist, creating a balancing act for investors. This week's release of China's first-quarter gross domestic product (GDP) data is anticipated to have a positive impact on commodity prices. The International Energy Agency (IEA) has forecasted that the data will account for most of the expected demand growth in 2023. However, the IEA has also cautioned that the output cuts announced by OPEC+ producers may worsen an oil supply deficit expected in the second half of the year, potentially hurting consumers and global economic recovery. Refiners are increasing gasoline output in preparation for peak summer demand, while reducing diesel production as margins decline.

From a technical standpoint, the market is currently lacking a clear direction as prices have reached a strong resistance level and are awaiting strong data or movement from the demand or supply side to determine the next move. The next support levels are at 85.60 followed by 83.5, while the next resistance levels are at 87 and 88.
Support:85.60 – 83.50 – 82.00 Resistance: 87.00 – 88.00 – 89.00
1681725943203.png
 
The Chinese economy is showing faster-than-expected growth, but the market's reaction has been fairly muted.
On Tuesday, several Asian stock markets traded in a flat-to-low range, with mainland China shares slightly gaining, while benchmarks in Hong Kong, South Korea, and Australia declined. This was largely due to fears of rising U.S. interest rates outweighing optimism over stronger-than-expected Chinese economic growth. In contrast, futures for European contracts pointed to gains, while US equity contracts were little changed.

China's National Bureau of Statistics reported a sharp rise in gross domestic product for the first quarter, with growth reaching 4.5%, marking the highest level since the first quarter of last year. The figure was better than the 4% forecast in a Reuters poll, and the economy also grew 2.2% quarter-on-quarter. While the reading showed that the country's economic recovery was on track, other data revealed an uneven rebound. Industrial production missed estimates for a second straight month in March, indicating that the country's massive manufacturing sector was struggling to recover from COVID-era lows. Additionally, property investment was still lagging and fell short of expectations.

EURUSD
The possibility of a slower pace of interest rate hikes by the European Central Bank (ECB) may discourage traders from making aggressive bullish bets on the euro, as ECB policymakers have not ruled out a downward shift. Martins Kazaks, a member of the ECB, hinted on Monday that the bank could opt for a 25-basis-point hike at the May meeting. Meanwhile, the Federal Reserve is expected to continue raising interest rates, which could support the US dollar and limit the upside potential of the euro, at least for the time being. Traders are now awaiting the release of key sentiment figures for April in the Eurozone and Germany, while the US economic docket features housing market data, including Building Permits and Housing Starts, during the early North American session.

The correction in EURUSD has ended as predicted by technical analysis around the downward parallel of the long bullish channel and the 100MA. The next target is the resistance level of 1.0965, followed by 1.1000. However, if the pair breaks the 100MA, it could confirm a bearish stance and move back to the downside.

Support: 1.0920– 1.0885 – 1.0840 Resistance: 1.0965 – 1.1000 – 1.1045

1681813007690.png


GBPUSD


The Office for National Statistics announced that the UK's unemployment rate increased to 3.8%, marking the highest rate since the second quarter of 2022, instead of remaining steady at 3.7%. However, pay growth exceeded expectations, which poses a dilemma for the Bank of England (BoE) as it assesses whether to proceed with further interest rate hikes.
The BoE has forecast that inflation will fall below 4% by the end of the year as wholesale energy prices fall, but financial markets see an 80% chance that it will raise borrowing costs for a 12th meeting in a row next month to 4.5% from 4.25%.

The US dollar rose as the market's expectation of a single rate hike at the next Federal Reserve meeting appeared overly optimistic, given recent speeches by Fed members reaffirming their hawkish stance. The central bank's view is that inflation has yet to show enough signs of slowing down, which could lead to a reassessment of the market's pricing, potentially resulting in at least two hikes of 0.25%.

Technically, the neck level of 1.2350 of the double top pattern detected on the 4H and daily chart is still holding. After yesterday's correction on the downside, the pair has recovered today as the dollar appears to be facing more selling pressure. While the 1.2350 level could serve as a support level from which the upper long-term trend may face strong selling pressure right now, the next resistance targets are at 1.2425 and 1.2450.

Support: 1.2350– 1.2280 – 1.2200 Resistance: 1.2425 – 1.2450 – 1.2480
1681813097639.png

USDJPY
On Monday, the US dollar showed strength against all major currencies, breaking out of the upper side of the old range. The first resistance level was found at 134.7, which was the same level seen on March 15th, 2023. However, the bullish short trend needs more confirmation to the upside, especially with a breakout of the psychological level at 134.5. The next support levels are at 133.75, which has acted as strong resistance for the past four months. A target of 135.7 would be optimistic for the pair to form a solid bullish trend on the 4H chart.

On the daily chart, it appears that the price has broken out of the bearish channel, and the accumulation seen after reaching 128.00 could potentially lead to the formation of a bullish trend on the pair.

Support: 133.75 – 133.00 – 132.50 Resistance: 134.7 – 135.30 – 135.70
1681813141735.png

XAUUSD
Although the US Dollar and Treasury bond yields have recently retreated, positive US economic data and expectations of further hawkish moves by the Federal Reserve are providing support to the USD, making it challenging for gold buyers. The NY Empire State Manufacturing Index for April rose to 10.8, breaking a four-month downtrend and marking the highest level since July of last year. In addition, the US National Association of Home Builders housing market index increased for the fourth consecutive month in April to 45, beating expectations of 44. Richmond Fed President Thomas Barkin stated that he wants to see more evidence of inflation settling back to target.

Despite being bullish on the long term, gold has been affected by the shift in market sentiment and has retreated to find support at the 100MA at 1993 after a strong Dollar and Yields took center stage. Price action on the Daily chart indicates that a break of the 1990 support level could lead to a significant correction.
Support: 1991 –1980 – 1960 Resistance: 2011 – 2020 – 2032
1681813168895.png


UKOIL
Oil prices increased following better-than-expected economic data from China, which showed a 4.5% YoY growth in Q1, beating economists' expectations of a 4% rise. Investors and analysts believe that China's reopening from its Covid-19 lockdowns will further support gains in oil prices. However, the possibility of another U.S. interest rate hike continues to limit the upside of oil, as it has been supporting the U.S. dollar. U.S. crude inventories are expected to decline by around 2.5 million barrels, while gasoline and distillate inventories are also expected to fall, according to analysts.

Brent touched the 85 level but faced selling pressures, falling towards the next solid support around 83.6 level. The price action is still limited in terms of showing any signs of direction, and this week's economic developments could determine Brent's direction.

Support:84.30 – 84.00 – 83.60
Resistance: 85.30 – 85.60 – 86.40


1681813205898.png
 
Fed officials seem divided on rate hikes while Asian stocks sink
On Wednesday, several Asian stock markets experienced declines due to uncertainty surrounding U.S. monetary policy, which overshadowed the positive outlook for China's economic recovery. The focus has now shifted towards various indicators being released by the Federal Reserve this week. China's Shanghai Shenzhen CSI 300 and Shanghai Composite indexes fell by 0.5% and 0.3%, respectively, after an initial surge from Tuesday's better-than-expected Q1 GDP data seemed to have lost momentum.

Yesterday, Goldman Sachs Group Inc. reported disappointing results, with traders failing to take advantage of Wall Street's fixed-income boom. As a result, firm-wide revenue fell short of expectations. Meanwhile, Bank of America Corp. exceeded profit expectations, and Netflix's subscriber growth and revenue outlook missed projections, causing a drop in its stock price after the bell.

Atlanta Federal Reserve President Raphael Bostic predicted one more rate hike of 25 basis points before pausing to assess its impact on the economy, which would take the Federal Funds rate to 5% to 5.25%. However, St. Louis Federal Reserve President James Bullard favors a higher terminal rate of between 5.50% and 5.75%.

EURUSD

The April German ZEW survey was mixed. The Current Situation Index improved from -46.5 to -32.5, surpassing expectations, but the Economic Sentiment Index fell unexpectedly from 13 to 4.1. On Wednesday, the Euro Zone March Consumer inflation report is due; it is the final reading, so it should not impact markets. Also scheduled is the February Current Account and Construction Output for the same month. European Central Bank's Lane and Schnabel will speak.

Atlanta Federal Reserve President Raphael Bostic expects one more rate hike of 25 basis points before pausing, while St. Louis Federal Reserve President James Bullard favors a higher terminal rate of between 5.50% and 5.75%. These divergent opinions have increased the divide within the Fed regarding the best way to end the current hiking cycle.

The EURUSD continued its upward trend yesterday, confirming its long bullish trend. The price action has been respecting the parallels and median levels of the bullish channel, and the pair may continue to rise if it breaks the 1.0980 level, potentially leading to a touch of the round number 1.1000. While there is uncertainty in the market regarding fundamental factors, there is some clarity on the direction of EURUSD, Gold, and US10Y, as they approach important resistance and support levels that may determine new directions or continuations in their current trends.
Support: 1.0920– 1.0885 – 1.0840
Resistance: 1.0965 – 1.1000 – 1.1045

1681896373437.png


GBPUSD

The UK's Office for National Statistics released data on Tuesday showing a slight increase in the ILO Unemployment Rate to 3.8% in February (3 months/YoY) from 3.7%, while the Average Earnings Excluding Bonus remained unchanged at 6.6%, surpassing the market's expected 6.2%. Additionally, the latest inflation figures published today indicated a decline in the annualized CPI to 10.1% in March from a 10.4% increase in February, with the money markets now indicating a 97% chance of the BoE raising Bank Rate to 4.5% in May.

Technically, the CPI data has led to new higher highs for the pair, with the market pricing in more hikes to combat inflation. The next resistance level is at 1.2470, and a breakout above that could push the pair to 1.2500 and 1.2550. On the downside, 1.2400 will be an important support level, followed by the last strong support level around 1.2350.
Support: 1.2440– 1.2400 – 1.2350 Resistance: 1.2470 – 1.2500 – 1.2550

1681896400202.png


USDJPY

The recent speeches from FED members have had a positive impact on the USD, causing it to rise against several currency pairs. The increasing expectation for more rate hikes beyond June has led to higher Treasury yields, which have in turn aided the USDJPY in breaking through new resistance levels. This suggests a growing sentiment towards a higher terminal rate from the FED. Also we need to mention the new Bank of Japan Governor Kazuo Ueda reiterated that the central bank will maintain its ultra-loose monetary policy and the worsening local economic conditions also weighed on the yen

The USDJPY pair continued to advance and confirmed the reversal on the 4-hour chart, as the previous resistance level at 133.75 turned into support after holding the pair within a price range for a long period since the beginning of the year. The pair also broke through the resistance level at 134.70, making the next target at 135.50 seem reachable.

Support: 133.75 – 133.00 – 132.50 Resistance: 134.7 – 135.30 – 135.70

1681896425613.png


XAUUSD


The market is closely watching for signals from the Federal Reserve, with the Beige Book economic report due later on Wednesday, and speeches from Fed Governors Christopher Waller and Lisa Cook scheduled for Thursday and Friday, respectively. The possibility of hawkish comments from Fed officials, combined with signs of resilience in the US economy, has raised concerns that interest rates could rise more than anticipated. This could negatively impact gold and other metals, as higher interest rates increase the opportunity cost of holding non-yielding assets. However, precious metals have been boosted by safe haven demand amid fears that rising interest rates may have a negative impact on economic growth in the coming year.

The recent strengthening of the dollar and rise in Treasury yields are impacting the price of gold and suggest that a correction may be underway. The level of 1987 is currently acting as a support, but a break below it could see the price drop to 1975, which is a relatively weaker support level. The 1950 level, which is a strong point of confluence and also where the 200MA on the 4H chart is located, is likely to provide significant support if the price continues to fall.
Support: 1987 –1975 – 1950
Resistance: 2011 – 2020 – 2032

1681896458989.png


UKOIL


Oil prices edge lower as demand concerns outweigh signs of falling inventories and strong Chinese data. Brent crude oil declined 0.5% to $84.32 a barrel. Oil prices shrugged at Chinese GDP data Tuesday that was stronger than expected, while prices seem to be similarly unimpressed by American Petroleum Institute data that showed U.S. crude inventories fell last week. Market also weighed potential interest rate hikes from the U.S. Federal Reserve that could slow growth and dampen oil consumption. The official inventory report by the Energy Information Administration, the statistical arm of the U.S. Department of Energy, is due to be released on Wednesday.

It appears that Brent has started to experience a selloff, which has taken it towards the down parallel of the bullish trend that began two weeks ago. The 100MA at the 83 level may serve as a strong support level. Once the 83 level is breached, the next target could be closing the gap at around 79.5.
Support:83.00 – 80.00 – 79.70
Resistance: 83.60 – 85.00 – 86.40
 
Top