"Market Update: US Index Futures Flat, Major Currencies Negative, Precious Metals Down, Asian Markets Decrease, Oil Tumbles, and US Dollar Index Rises"
On Tuesday, several currencies from Asian countries experienced a decline, whereas the value of the dollar increased slightly. This was due to the anticipation surrounding the upcoming interest rate decision from the Federal Reserve, which resulted in market caution. Furthermore, there were ongoing concerns about a banking crisis that added to the negative outlook.
According to sources familiar with the situation, US officials are contemplating various options to temporarily broaden the scope of Federal Deposit Insurance Corporation (FDIC) coverage to include all bank deposits. Bloomberg reported this on Monday.
Investors found some relief on Tuesday following the announcement of the rescue of Credit Suisse, a struggling financial institution, by its Swiss counterpart UBS. However, there is still some unease about the potential for this crisis to cause further disruptions in credit markets and harm smaller US banks.
The focus has now shifted to the upcoming meeting of the US Federal Reserve, with many traders speculating about whether the central bank will continue to raise interest rates, which some blame for causing the crisis, or if there will be a pause in the rate hikes.
The yield on 10-year Treasury notes increased to 3.49%. The 2-10-year yield spread is at -41 bps. However, the 10Y real rate widens to 118 bps today.
EURUSD
Fundamental Outlook: Goldman Sachs revised its economic growth projection for the eurozone in 2023, citing persistent turmoil in the global banking system and rising economic uncertainty. The investment bank lowered its growth forecast for the region by 0.3%, resulting in a projected GDP growth rate of 0.7% for 2023.
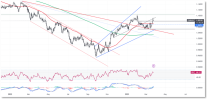
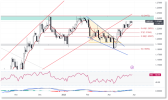
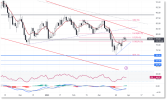
Technical Analysis: The currency pair is experiencing difficulties in breaking above the 50-day moving average and seems to be encountering a barrier at this point once more. This is indicated by the purple line on the chart. However, the 200-day exponential moving average, represented by the yellow line, is providing support from below. Additionally, the 1.0685 level can be considered as a support level. On the other hand, if the pair manages to surpass the 1.0725 level, it will be viewed as a critical resistance level and closely monitored.
Support: 1.0685 – 1.0660 – 1.0605
Resistance: 1.0725 – 1.0760 – 1.0775
GBPUSD
Fundamental Outlook: Goldman Sachs has revised its economic outlook for the UK, stating that it expects zero economic growth for the country in 2023. Furthermore, the investment bank no longer predicts that the Bank of England (BoE) will raise its policy rate in May. As a result, Goldman Sachs has maintained its forecast for the BoE's terminal rate at 4.25%.
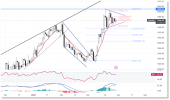
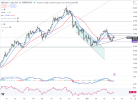
Technical Analysis: The pound has recently broken above the 0.618 Fibonacci retracement level with a long bullish candlestick. If it can maintain its position above this level, there is potential for further upward movement towards the green area on the chart. However, traders should keep a close eye on the 1.2270 level as it could act as resistance and potentially push the pound back down. On the other hand, the 1.2205 level can be seen as a support level and may provide a level of protection for the pound if it experiences any downward pressure.
Support: 1.2205 – 1.2160 – 1.2125
Resistance: 1.2270 – 1.2315 – 1.2365

USDJPY
Fundamental Outlook: There is speculation among analysts that the Bank of Japan (BOJ) will adjust or terminate its Yield Curve Control (YCC) policy during Toshiro Ueda's five-year tenure as the governor. The BOJ's extensive bond purchases aimed at maintaining the yield cap are being criticized for distorting the yield curve's shape and draining liquidity from the bond market. Therefore, many analysts anticipate changes to this policy.
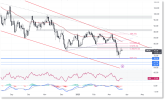
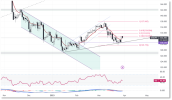
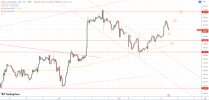
Technical Analysis: The technical analysis of the currency pair suggests a prevailing downtrend, which was further confirmed by a recent breakdown below the previously established uptrend line. This led to a decline below the 50-day moving average, depicted by the purple line, indicating a potential bearish sentiment in the market. In case the support level fails to hold, it could trigger an increase in selling pressure, leading to a possible downtrend. To avoid such a situation, traders should closely watch the 130.55 level, which could serve as a crucial support level. On the other hand, the 132.60 level may act as resistance and halt any upward momentum. However, if the price manages to break above this level, it could attract buyers, potentially causing an uptrend that could surpass the 8-day exponential moving average
Support: 130.55 – 129.85 – 128.35 Resistance: 132.60 – 133.10 – 134.00

XAUUSD
Fundamental Outlook: In early trading on Tuesday, gold prices remained stable and did not experience any significant fluctuations, despite reaching important highs in the previous session. Market participants were taking some profits off the table in anticipation of the Federal Reserve's upcoming interest rate decision. At the same time, the continuing concerns about a potential banking crisis are supporting the demand for safe-haven assets.
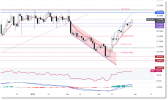
Technical Analysis: Gold's strong nine-day rally came to a halt yesterday when the precious metal reached a high of 2009 before encountering profit-taking, leaving a long wick at that level. This suggests that traders were taking profits after the metal broke above the 2000 psychological resistance level. Technically speaking, the short-term resistance level for gold is around 1985. If the profit-taking continues, the metal may find support around the 1968 level. Therefore, traders should keep a close eye on these levels to identify potential trading opportunities.
Support: 1968 – 1950 – 1935
Resistance: 1985 – 2000 – 2009

XAGUSD
Fundamental Outlook: Over the past week, the price of silver increased considerably due to increasing concerns about the possibility of a banking collapse in both the US and Europe. As a result, many investors sought refuge in traditional safe-haven assets such as silver. Furthermore, there are growing expectations that the Federal Reserve may not have the necessary economic conditions to continue raising interest rates, which is negatively impacting the value of the dollar.
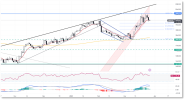
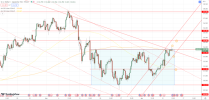
Technical Analysis: Silver has been maintaining its uptrend with no signs of a trend reversal. The chart shows a significant resistance level at 22.80. Besides, a pennant formation is visible, which indicates a potential bullish breakout. If the price surpasses the resistance level at 22.80, it could lead to further price increases towards the 23.00 level. On the downside, the 22.30 level, represented by the 50-day simple moving average, is a crucial support level, and traders should monitor it closely for any possible trend reversals. In summary, the technical analysis suggests a bullish outlook for silver, but traders should be cautious and keep an eye on the crucial levels for potential trading opportunities.
Support: 22.30 – 22.02 – 21.80
Resistance: 22.80 – 23.00 – 23.22

UKOIL
Fundamental Outlook: In the early hours of Tuesday, oil prices experienced a decline in Asian trade, interrupting a short-lived recovery from their lowest point in 15 months. This drop in oil prices occurred as investors adopted a cautious stance before the Federal Reserve's upcoming interest rate decision. Additionally, concerns regarding a banking crisis persist and are prompting traders to be more careful with their investments.
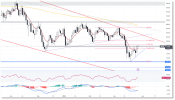
Technical Analysis: Brent oil exhibited a series of falling candles before closing yesterday with a long wick candle. This suggests that buyers are active around the 70 levels, and the support at this level is preventing further price declines. The 70.20 level is a critical support level in this respect, and traders should monitor it closely. On the upside, the short-term resistance level to watch is around 74.65. If the price manages to break above this level, it could indicate a potential bullish trend, and traders may look for buying opportunities. However, traders should be cautious and closely watch the support and resistance levels for any potential trend reversals.
Support: 72.40 – 71.85 – 70.20
Resistance: 74.65 – 75.75 – 77.70

On Tuesday, several currencies from Asian countries experienced a decline, whereas the value of the dollar increased slightly. This was due to the anticipation surrounding the upcoming interest rate decision from the Federal Reserve, which resulted in market caution. Furthermore, there were ongoing concerns about a banking crisis that added to the negative outlook.
According to sources familiar with the situation, US officials are contemplating various options to temporarily broaden the scope of Federal Deposit Insurance Corporation (FDIC) coverage to include all bank deposits. Bloomberg reported this on Monday.
Investors found some relief on Tuesday following the announcement of the rescue of Credit Suisse, a struggling financial institution, by its Swiss counterpart UBS. However, there is still some unease about the potential for this crisis to cause further disruptions in credit markets and harm smaller US banks.
The focus has now shifted to the upcoming meeting of the US Federal Reserve, with many traders speculating about whether the central bank will continue to raise interest rates, which some blame for causing the crisis, or if there will be a pause in the rate hikes.
The yield on 10-year Treasury notes increased to 3.49%. The 2-10-year yield spread is at -41 bps. However, the 10Y real rate widens to 118 bps today.
EURUSD
Fundamental Outlook: Goldman Sachs revised its economic growth projection for the eurozone in 2023, citing persistent turmoil in the global banking system and rising economic uncertainty. The investment bank lowered its growth forecast for the region by 0.3%, resulting in a projected GDP growth rate of 0.7% for 2023.
Technical Analysis: The currency pair is experiencing difficulties in breaking above the 50-day moving average and seems to be encountering a barrier at this point once more. This is indicated by the purple line on the chart. However, the 200-day exponential moving average, represented by the yellow line, is providing support from below. Additionally, the 1.0685 level can be considered as a support level. On the other hand, if the pair manages to surpass the 1.0725 level, it will be viewed as a critical resistance level and closely monitored.
Support: 1.0685 – 1.0660 – 1.0605
Resistance: 1.0725 – 1.0760 – 1.0775
GBPUSD
Fundamental Outlook: Goldman Sachs has revised its economic outlook for the UK, stating that it expects zero economic growth for the country in 2023. Furthermore, the investment bank no longer predicts that the Bank of England (BoE) will raise its policy rate in May. As a result, Goldman Sachs has maintained its forecast for the BoE's terminal rate at 4.25%.
Technical Analysis: The pound has recently broken above the 0.618 Fibonacci retracement level with a long bullish candlestick. If it can maintain its position above this level, there is potential for further upward movement towards the green area on the chart. However, traders should keep a close eye on the 1.2270 level as it could act as resistance and potentially push the pound back down. On the other hand, the 1.2205 level can be seen as a support level and may provide a level of protection for the pound if it experiences any downward pressure.
Support: 1.2205 – 1.2160 – 1.2125
Resistance: 1.2270 – 1.2315 – 1.2365
USDJPY
Fundamental Outlook: There is speculation among analysts that the Bank of Japan (BOJ) will adjust or terminate its Yield Curve Control (YCC) policy during Toshiro Ueda's five-year tenure as the governor. The BOJ's extensive bond purchases aimed at maintaining the yield cap are being criticized for distorting the yield curve's shape and draining liquidity from the bond market. Therefore, many analysts anticipate changes to this policy.
Technical Analysis: The technical analysis of the currency pair suggests a prevailing downtrend, which was further confirmed by a recent breakdown below the previously established uptrend line. This led to a decline below the 50-day moving average, depicted by the purple line, indicating a potential bearish sentiment in the market. In case the support level fails to hold, it could trigger an increase in selling pressure, leading to a possible downtrend. To avoid such a situation, traders should closely watch the 130.55 level, which could serve as a crucial support level. On the other hand, the 132.60 level may act as resistance and halt any upward momentum. However, if the price manages to break above this level, it could attract buyers, potentially causing an uptrend that could surpass the 8-day exponential moving average
Support: 130.55 – 129.85 – 128.35 Resistance: 132.60 – 133.10 – 134.00
XAUUSD
Fundamental Outlook: In early trading on Tuesday, gold prices remained stable and did not experience any significant fluctuations, despite reaching important highs in the previous session. Market participants were taking some profits off the table in anticipation of the Federal Reserve's upcoming interest rate decision. At the same time, the continuing concerns about a potential banking crisis are supporting the demand for safe-haven assets.
Technical Analysis: Gold's strong nine-day rally came to a halt yesterday when the precious metal reached a high of 2009 before encountering profit-taking, leaving a long wick at that level. This suggests that traders were taking profits after the metal broke above the 2000 psychological resistance level. Technically speaking, the short-term resistance level for gold is around 1985. If the profit-taking continues, the metal may find support around the 1968 level. Therefore, traders should keep a close eye on these levels to identify potential trading opportunities.
Support: 1968 – 1950 – 1935
Resistance: 1985 – 2000 – 2009
XAGUSD
Fundamental Outlook: Over the past week, the price of silver increased considerably due to increasing concerns about the possibility of a banking collapse in both the US and Europe. As a result, many investors sought refuge in traditional safe-haven assets such as silver. Furthermore, there are growing expectations that the Federal Reserve may not have the necessary economic conditions to continue raising interest rates, which is negatively impacting the value of the dollar.
Technical Analysis: Silver has been maintaining its uptrend with no signs of a trend reversal. The chart shows a significant resistance level at 22.80. Besides, a pennant formation is visible, which indicates a potential bullish breakout. If the price surpasses the resistance level at 22.80, it could lead to further price increases towards the 23.00 level. On the downside, the 22.30 level, represented by the 50-day simple moving average, is a crucial support level, and traders should monitor it closely for any possible trend reversals. In summary, the technical analysis suggests a bullish outlook for silver, but traders should be cautious and keep an eye on the crucial levels for potential trading opportunities.
Support: 22.30 – 22.02 – 21.80
Resistance: 22.80 – 23.00 – 23.22
UKOIL
Fundamental Outlook: In the early hours of Tuesday, oil prices experienced a decline in Asian trade, interrupting a short-lived recovery from their lowest point in 15 months. This drop in oil prices occurred as investors adopted a cautious stance before the Federal Reserve's upcoming interest rate decision. Additionally, concerns regarding a banking crisis persist and are prompting traders to be more careful with their investments.
Technical Analysis: Brent oil exhibited a series of falling candles before closing yesterday with a long wick candle. This suggests that buyers are active around the 70 levels, and the support at this level is preventing further price declines. The 70.20 level is a critical support level in this respect, and traders should monitor it closely. On the upside, the short-term resistance level to watch is around 74.65. If the price manages to break above this level, it could indicate a potential bullish trend, and traders may look for buying opportunities. However, traders should be cautious and closely watch the support and resistance levels for any potential trend reversals.
Support: 72.40 – 71.85 – 70.20
Resistance: 74.65 – 75.75 – 77.70