Trading Strategies are a part of every trader’s routine. Fundamental and technical analyses are the foundation for most  trading strategies. The majority of them are based on technical analysis as traders look for short term gains which fundamental analysis by its very nature can hardly offer. In order to get the optimum profits, however, it is best to consider both types of analysis. Fundamental analysis has a longer horizon and requires more time to study, but the benefit of higher returns with greater precision overpays the efforts put in.
A quick look at each of the analysis types shows their respective strengths.
Fundamental analysis studies the causes of market movements and gets to the root of forces that drive the supply and demand of currencies based on economic, political, environmental and other relevant factors. Fundamental analysis mainly focuses on qualitative data and looks at the long-term scenario. It indicates the general direction of the market. The fundamental analyst focuses on investment, which is a longer-term activity, as compared to a technical analyst who focuses on short-term trading.
Technical analysis, on the other hand, is the art of using the history to predict the future: Based on the assumption that “history repeats itself” technical analysis uses historic data and developments to systematically predict future movements. Technical analysts therefore look for chart patterns that have formed similarly in the past, and use various technical indicators to identify entry and exit points for a particular trading strategy with the baseline assumption that prices will make the same movements as they did in the past.
Steps for strategy formulation
The two approaches of analysis are quite different, but each of them has its own benefits and limitations. It is always better to rely on a blend of both the approaches, which helps minimizing risks and maximizing chances. Two easy steps help formulating a trading strategy that takes both forms of analysis into account.
1. Track economic events and fundamental news announcements: It is always advisable to start with fundamental analysis in order to formulate a strategy. Fundamental analysis is comprised of various economic events and news which affect the supply and demand of a certain currency. So before starting to trade a currency pair, an investor should check all economic events and news related to the currencies’ home countries. A schedule of important events relating to central bank policies and economic data like employment figures is known as a ‘Forex calendar’ and available on many websites.
Despite noting the date of a release, an investor should always also evaluate the significance of an announcement: Some events have the power to move the forex market, while others go without consequences; some events have only a very local influence while some affect an entire industry or region. For example, a release of a Chinese HSBC Manufacturing PMI is a signal which affects the entire industrial world and especially Australia and New Zealand, while UK GDP release affects only GBP.
Timing is important: Successful investors study economic news as soon as they are released to make sure they can react immediately. If the news is better than the market expectations, it indicates buying signal for that particular currency pair or for the bunch of currency pair (depending upon the nature of the release).
Not only the current outcome of a release counts, but investors should look at its historical context: Did the results match the historical releases, surpass them or maybe lag behind them? The markets will react to that. If expectations were low backed by historically weaker data, even meager improvements above the benchmark may signal more positivity for a particular currency pair. On the other hand, if the event had spurred positive expectations beforehand due to continuous improvements in the past, even small deficiency in the actual release as compared to prior releases or forecasts should not affect the overall optimism and the pair could continue its upward trend.
2. Concern the technical analysis to set entry and exit points: Traders should now adhere to technical analysis in order to decide about entry and exit points for a particular currency pair. For that, investors look for various chart patterns, use technical indicators which define the breakout points and decide on the trading strategy. When formulating the trading strategy, it is important to consider various risk management tools, depending on the trading goals and the investment horizon.
For example:
Take the example of AUD/USD on May 7, 2013 – the day on which the Reserve Bank of Australia cut the benchmark interest rate by 25 bps to a record low of 2.75% in order to bolster the economic growth. Fundamentally this event indicates the depreciation of the Australian Dollar against other its parts (we’ll take USD for the sake of simplicity). But the news does not signal prompt selling; one must consult the technical analysis to support the selling view. There are chances that the currency pair may move upward first and then correct.
By conducting technical analysis with the help of the trading platform Meta Trader 4 we can determine the exact entry and exit points as follows:
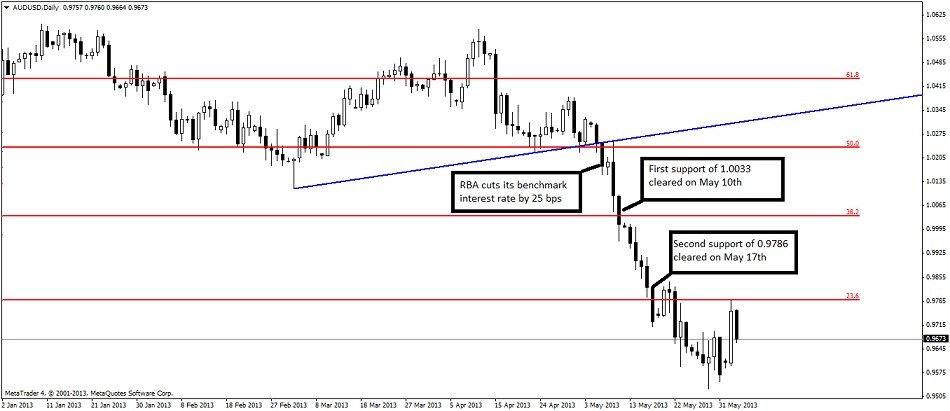
The daily chart of AUD/USD signals a sustained breakdown of the ascending trend line near 1.0248 on May 7, which signals selling pressure. But the pair is still left to break 1.0234 ( the 50% retracement level of its 1.1024 to 0.9387 downfall). If it breaks that level and sustains the breakdown, technically the next supports should be 1.0033 (the 38.2% retracement level) and then 0.9786 (the 23.6% retracement level). If on May 7 the pair keeps on trading below the 1.0234 level, investors should take a sell position.
In the end, the pair breached 1.0033 (the 38.2% retracement level) on May 10 and the 23.6% retracement level of 0.9786 on May 17.
Hence, from a fundamental perspective the AUD was due to be depreciated because of the interest rate cut, and technical analysis determined the point of entry (below the 1.0234 level) and subsequent points of exits (the 38.2% and 23.6% retracement levels).
Evaluation: The above mentioned approach of formulating a trading strategy based on fundamental and technical analysis is considered to be of great value for traders. Even though it consumes more time compared to simple technical analysis, it has its own advantages. Traders who practice scalping or trading, however, should not practice this strategy, as it is too long-term for those very short-horizon-strategies. When looking out for the best Forex calendar, it is important to identify the website which offers the most precise forecast of the event, an evaluation of its significance as well as swift updates once the news are released.
Contribution by Admiral Markets India
Speak Your Mind