XAU/USD: a tendency to further decline remains
12/09/2019
Last Friday, the price of gold was under pressure after the publication by the US Department of Labor of data according to which in November 266,000 jobs were added (against the forecast of +180,000 and +156,000 in October) outside the US agriculture. At the same time, the unemployment rate fell to 3.5% from 3.6%, the minimum since 1969.
At the end of the trading day on Friday, gold was trading at $ 1,461 an ounce. Also, pressure on gold prices in the short term will be provided by the information on progress in the development of a trade agreement between the United States and China. Earlier, Donald Trump threatened to introduce on December 15 a new series of protective duties that will affect Chinese goods worth about $ 156 billion. Neither side is interested in disrupting the negotiations, which will inevitably be followed by another round of escalation of the trade conflict.
Investors hope that countries will be able to sign an agreement before December 15, when new customs duties on Chinese goods when they are imported into the United States, must be entered into force.
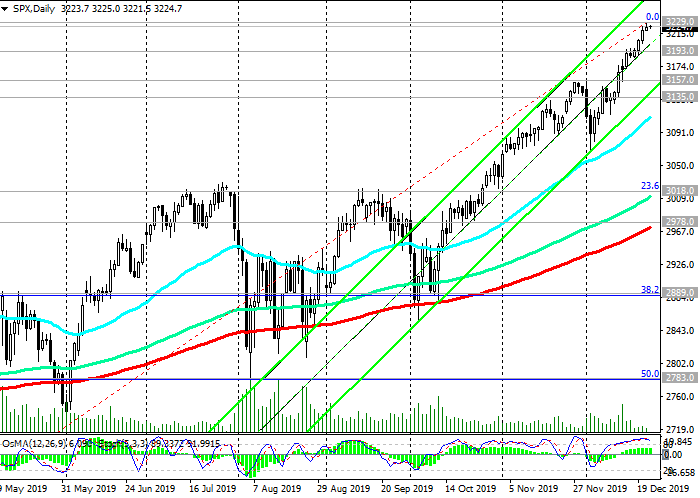
Another disruption of the trade agreement between the United States and China or weak macro data from the United States could trigger a fall in world stock indices and higher gold prices.
Also, this week will be the next Fed meeting. Earlier, the central bank said that monetary policy is likely to remain unchanged in December.
If the Fed signals an intention to maintain current policy unchanged, then gold is likely to continue to remain under pressure, given the prospect of a trade agreement between the United States and China, as well as strong macro data from the United States.
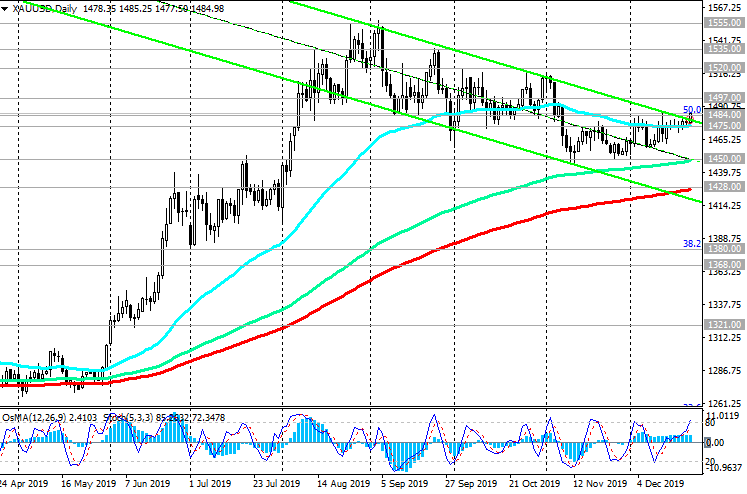
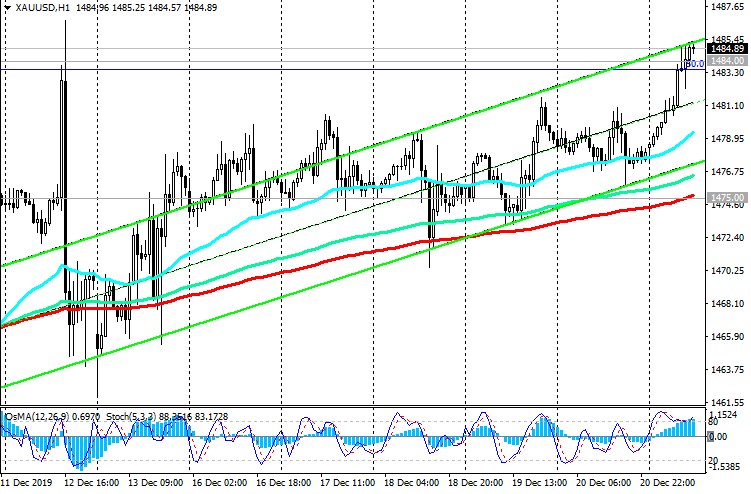
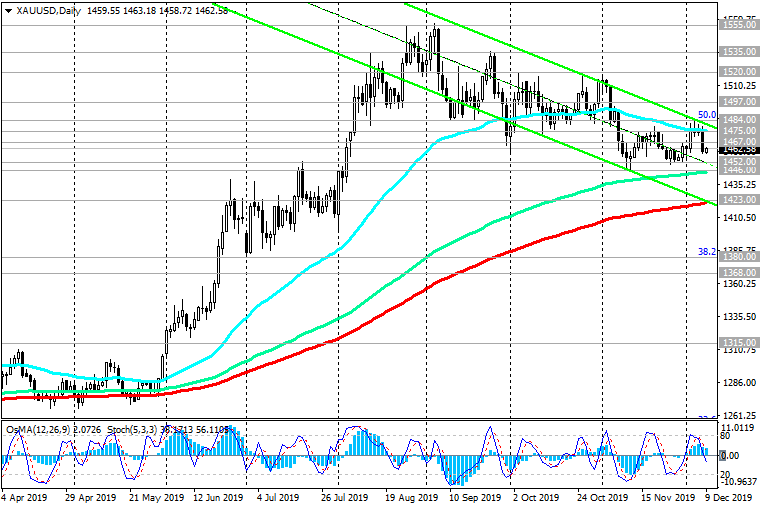
At the beginning of the European session on Monday, XAU / USD is trading below important short-term resistance levels of 1467.00 (EMA200 on the 1-hour chart), 1475.00 (EMA200 on the 4-hour chart, EMA50 on the daily chart), while remaining 5 weeks in the range between the levels 1484.00 (Fibonacci level 50% of the correction to the wave of decline since September 2011 and the mark of 1920.00) and 1446.00 (ЕМА144 on the daily chart).
The tendency to further decline to the support levels of 1446.00, 1423.00 (EMA200 on the daily chart) remains. Breakdown of support levels of 1380.00 (Fibonacci level 38.2% and highs of 2016), 1368.00 (highs of 2018) can cancel the bullish trend XAU / USD.
Support Levels: 1452.00, 1446.00, 1423.00, 1380.00, 1368.00, 1310.00, 1253.00
Resistance levels: 1467.00, 1475.00, 1484.00, 1497.00, 1520.00, 1535.00, 1555.00, 1585.00
Trading Recommendations
Sell Stop 1445.00. Stop-Loss 1469.00. Take-Profit 1423.00, 1380.00, 1368.00
Buy Stop 1469.00. Stop-Loss 1445.00. Take-Profit 1475.00, 1484.00, 1497.00, 1520.00, 1535.00, 1555.00, 1585.00

*) For up-to-date and detailed analytics and news on the forex market visit Tifia Forex Broker website tifia.com
12/09/2019
Last Friday, the price of gold was under pressure after the publication by the US Department of Labor of data according to which in November 266,000 jobs were added (against the forecast of +180,000 and +156,000 in October) outside the US agriculture. At the same time, the unemployment rate fell to 3.5% from 3.6%, the minimum since 1969.
At the end of the trading day on Friday, gold was trading at $ 1,461 an ounce. Also, pressure on gold prices in the short term will be provided by the information on progress in the development of a trade agreement between the United States and China. Earlier, Donald Trump threatened to introduce on December 15 a new series of protective duties that will affect Chinese goods worth about $ 156 billion. Neither side is interested in disrupting the negotiations, which will inevitably be followed by another round of escalation of the trade conflict.
Investors hope that countries will be able to sign an agreement before December 15, when new customs duties on Chinese goods when they are imported into the United States, must be entered into force.
Another disruption of the trade agreement between the United States and China or weak macro data from the United States could trigger a fall in world stock indices and higher gold prices.
Also, this week will be the next Fed meeting. Earlier, the central bank said that monetary policy is likely to remain unchanged in December.
If the Fed signals an intention to maintain current policy unchanged, then gold is likely to continue to remain under pressure, given the prospect of a trade agreement between the United States and China, as well as strong macro data from the United States.
At the beginning of the European session on Monday, XAU / USD is trading below important short-term resistance levels of 1467.00 (EMA200 on the 1-hour chart), 1475.00 (EMA200 on the 4-hour chart, EMA50 on the daily chart), while remaining 5 weeks in the range between the levels 1484.00 (Fibonacci level 50% of the correction to the wave of decline since September 2011 and the mark of 1920.00) and 1446.00 (ЕМА144 on the daily chart).
The tendency to further decline to the support levels of 1446.00, 1423.00 (EMA200 on the daily chart) remains. Breakdown of support levels of 1380.00 (Fibonacci level 38.2% and highs of 2016), 1368.00 (highs of 2018) can cancel the bullish trend XAU / USD.
Support Levels: 1452.00, 1446.00, 1423.00, 1380.00, 1368.00, 1310.00, 1253.00
Resistance levels: 1467.00, 1475.00, 1484.00, 1497.00, 1520.00, 1535.00, 1555.00, 1585.00
Trading Recommendations
Sell Stop 1445.00. Stop-Loss 1469.00. Take-Profit 1423.00, 1380.00, 1368.00
Buy Stop 1469.00. Stop-Loss 1445.00. Take-Profit 1475.00, 1484.00, 1497.00, 1520.00, 1535.00, 1555.00, 1585.00
*) For up-to-date and detailed analytics and news on the forex market visit Tifia Forex Broker website tifia.com