• The Forex, Binary Options Forum - welcomes you to our Community!

    DigitalCashPalace Forum is dedicated to discussions about Forex, Binary Options, commodities, stocks related.

    Please take a look around, and feel free to .

XAU/USD: Current Dynamics

05/29/2019


US President Donald Trump said last Monday that he was “not yet ready” to conclude a trade agreement with China. In his opinion, against the background of "substantial progress" in trade negotiations with Japan, duties on Chinese imports "can easily be extremely substantially raised".

Trump's statement heightened investors' concerns about the growth prospects of the global economy, since a possible escalation of the trade conflict and the introduction of duties on goods from these countries would cause damage to both the American and Chinese economies, according to economists.

In this situation, the demand for defensive assets (gold, government bonds, yen) has grown significantly in recent days.

Thus, the growth in demand for US government bonds led to a significant drop in their profitability.

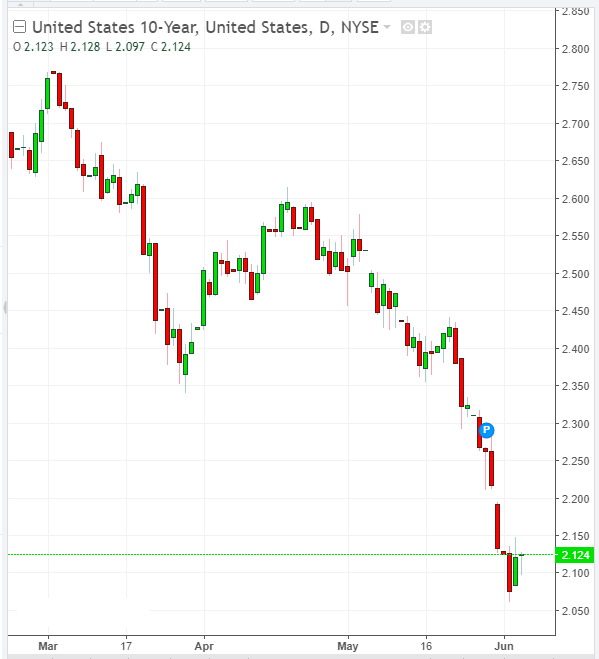
The yield on 10-year US government bonds fell last week to 2.292%. On Wednesday, their yield fell to 2,229%, the lowest since February 2018.

It is possible that the Fed will still start lowering interest rates in order to support American manufacturers. And this will lead to a decrease in the dollar and the growth of gold prices.

*)An advanced fundamental analysis is available on the Tifia Forex Broker website at tifia.com/analytics

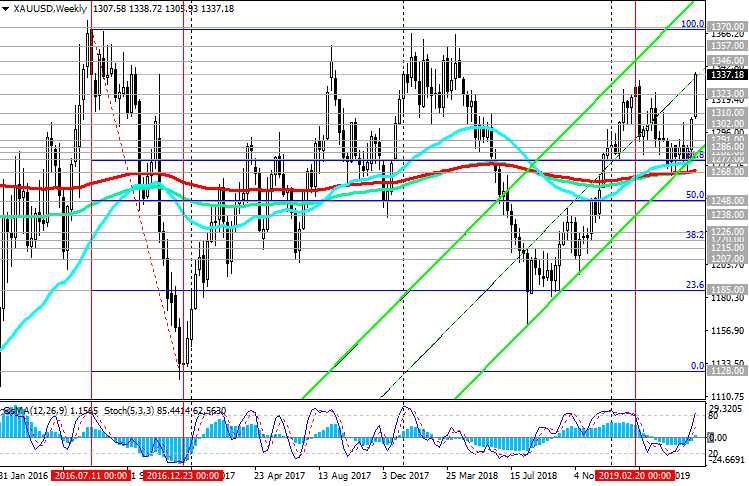
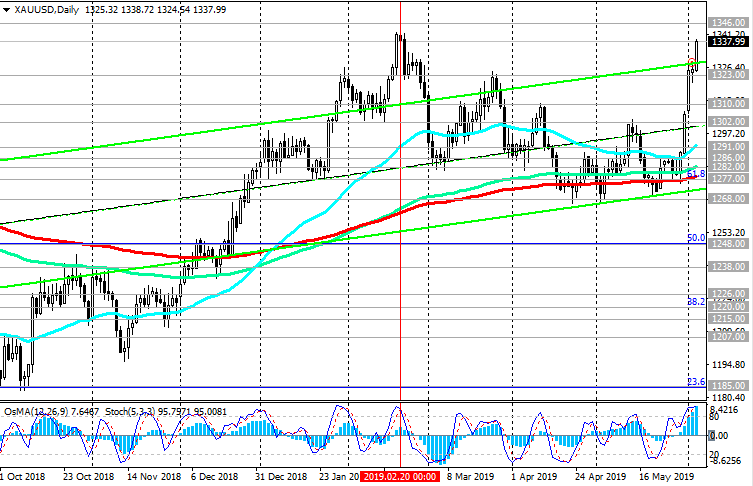
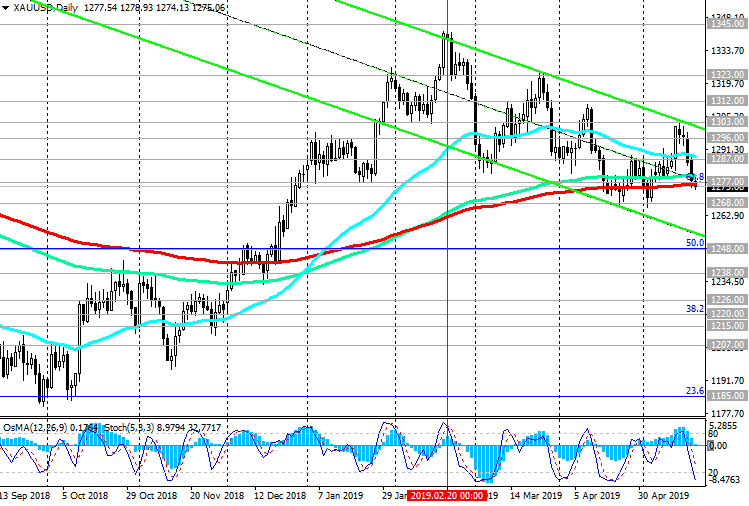
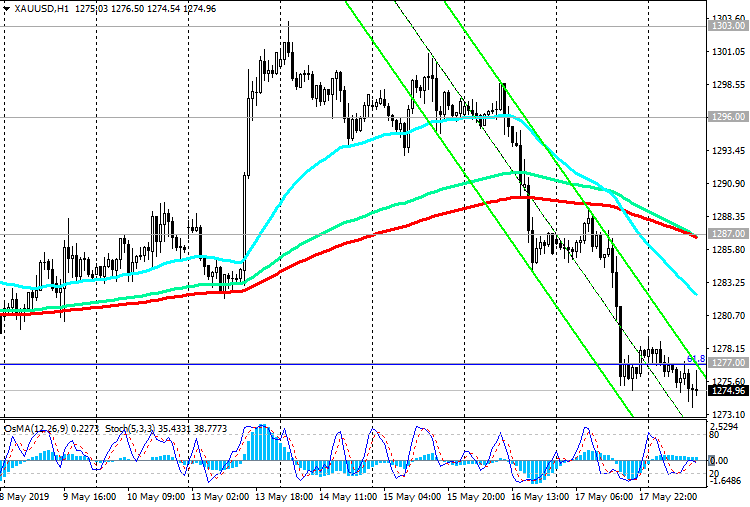
For the 6th week in a row, the XAU / USD has been trading in a narrow range near current levels and a key support level of 1277.00 (Fibonacci level 61.8% of the correction to the wave of decline since July 2016 and ЕМА200 on the daily chart).

Increased uncertainty in financial markets and the escalation of the trade conflict between the United States and China may lead to a resumption of the bullish XAU / USD trend.

The breakdown of the short-term resistance level of 1286.00 (EMA50 on the daily chart and EMA200 on the 4-hour chart) will be a signal for the resumption of upward dynamics and growth of XAU / USD with targets located at resistance levels of 1303.00, 1312.00, 1323.00, 1345.00 (maximums of February and 2019). This is the most likely scenario.

An alternative scenario implies the breakdown of the key support level of 1277.00, the lower line of the 1268.00 range, and a further decline to the lower boundary of the downward channel on the daily chart and to the support level of 1248.00 (Fibonacci level 50%), which will create prerequisites for XAU / USD to return to the global bearish trend with the reduction targets at the support levels of 1197.00 (November lows), 1185.00 (Fibonacci level 23.6%), 1160.00 (2018 lows).

Support Levels: 1277.00, 1268.00, 1248.00

Resistance Levels: 1286.00, 1296.00, 1303.00, 1312.00, 1323.00, 1345.00, 1357.00, 1365.00, 1370.00


Trading Recommendations


Sell Stop 1275.00. Stop Loss 1288.00. Take-Profit 1268.00, 1248.00, 1234.00, 1220.00, 1197.00, 1185.00, 1160.00

Buy Stop 1288.00. Stop Loss 1275.00. Take-Profit 1296.00, 1303.00, 1312.00, 1323.00, 1345.00, 1357.00, 1365.00, 1370.00

200519-DXY.png


200519-XU-D.png


200519-XU-H1.png


*) For up-to-date and detailed analytics and news on the forex market visit Tifia Forex Broker website tifia.com
 
USD/CAD: Current Dynamics and Market Expectations

05/30/2019


As expected by many market participants, at the last Wednesday meeting, the Bank of Canada kept the current monetary policy and key interest rate unchanged at 1.75%.

"The recent escalation of the trade conflict has increased uncertainty regarding economic prospects", the central bank said. At the same time, the leaders of the bank believe that the slowdown in economic growth in Canada is temporary, expecting an improvement in economic activity in the country and referring to the “acceleration in the 2nd quarter”.

The recent decision of the White House to remove duties on Canadian steel and aluminum "will have a positive impact on Canadian exports and investment", because it increased the likelihood of ratifying the revised North American Free Trade Agreement (NAFTA).

On Friday (12:30 GMT), an increase in volatility in the USD / CAD trades is expected due to the publication of important macro statistics for the US and Canada. It is expected that Canadian GDP grew by 1.3% in the 2nd quarter after weak growth in the first three months of the year. Some economists believe that growth in the 2nd quarter could exceed the central bank estimate and be 2% or higher.

At the same time, the April data on consumer spending in the United States, which will also be released at the same time, may adversely affect investors' expectations regarding the US economy if the data are weak after weak data on industrial production and retail sales in the United States, published earlier.

If weak macro data starts to come in from the USA, then the probability of a decrease in the Fed's interest rate will increase. Investors already estimate the likelihood of a rate cut in 2019 at 83% versus 64% a month ago.

It is also necessary to take into account that on the last trading day of the week and month many market participants will want to take profits in long positions in the US dollar, which will cause its decline.

*)An advanced fundamental analysis is available on the Tifia Forex Broker website at tifia.com/analytics

Thus, next month, a corrective decline in the USD / CAD pair may start with targets at the support levels of 1.3452 (Fibonacci level 23.6% of the downward correction to the pair growth in the global uptrend from September 2012 and 0.9700), 1.3435 (EMA200 on the 4 -hourly chart), 1.3420 (EMA50 on the daily chart).

The breakdown of the level 1.3420 will provoke a deeper decline to the support levels of 1.3325 (EMA144), 1.3275 (EMA200 on the daily chart). Above the key levels 1.3325, 1.3275, USD / CAD maintains a long-term positive trend.

A return to the zone above the local resistance level of 1.3520 will be a signal for the resumption of long positions with targets at the resistance levels of 1.3660 (2018 highs), 1.3790 (2017 highs).

Support Levels: 1.3465, 1.3452, 1.3435, 1.3420, 1.3325, 1.3275

Resistance Levels: 1.3520, 1.3600, 1.3660, 1.3790


Trading Scenarios


Sell Stop 1.3480. Stop Loss 1.3530. Take-Profit 1.3465, 1.3452, 1.3435, 1.3420, 1.3325, 1.3275

Buy Stop 1.3530. Stop-Loss 1.3480. Take-Profit 1.3600, 1.3660, 1.3790

300519-USCD-D.png


300519-USCD-H4.png


*) For up-to-date and detailed analytics and news on the forex market visit Tifia Forex Broker website tifia.com
 
WTI: pessimism grows - oil becomes cheaper

05/31/2019


The financial markets are dominated by pessimism of investors who prefer defensive assets, such as the yen, gold, and government bonds.

Thus, the yield on 10-year US government bonds after a decline last week to a multi-month low of 2.292%, today updated the minimum, dropping to 2.154%, marks in September 2017.

After the White House increased import duties on Chinese goods worth $ 200 billion last month, and US President Donald Trump threatened to expand barrage measures, in response, China imposed duties on US goods in $60 billion.

Last Monday, Donald Trump said that he was “not yet ready” to conclude a trade agreement with China.

New threats from the White House, now to the address of Mexico, have added another batch of negative to investors. On Friday, Trump threatened to impose duties on 5% for goods from Mexico on June 10. The threat will be enforced if the Mexican authorities do not take measures to prevent illegal immigration to the United States. Taxes on Mexican goods will be raised to 10% from July 1, to 15% from August 1, to 20% from September 1 to 25% from October 1, and will continue until Mexico’s authorities take effective measures to combat illegal immigration in USA.

In June, the attention of traders will switch to the scheduled OPEC meeting at the end of the month. Representatives of OPEC member countries, including Russia, have to decide whether to extend the agreement to reduce total oil production by the end of 2019. A slowdown in the global economy and a downward trend in oil prices may force the organization to continue to implement production reduction agreements in order to support prices.

In anticipation of this event, oil prices are likely to remain under pressure.

At 17:00 (GMT), the American oilfield services company Baker Hughes will present a weekly report on the number of active drilling rigs in the United States. Previous reports showed a decrease in the number of active oil platforms in the United States to 797 units.

Oil reserves in the United States remain at about 476.50 million barrels (22-month high), which is 5% higher than the average 5-year value for this time of year. If the Baker Hughes report indicates an increase in the number of such installations, this may give an additional negative impetus to prices.

*)An advanced fundamental analysis is available on the Tifia Forex Broker website at tifia.com/analytics

Mostly negative dynamics. At the beginning of the European session, WTI crude oil is quoted at $ 55.16 per barrel, below the important levels of 59.90 (EMA200, EMA144 on the daily chart), 59.50 (50% Fibonacci level). Last Thursday, the price of WTI crude oil broke through another major and key support level of 56.85 (EMA200 on the weekly chart).

If next week the price remains in the zone below support level 55.40 (Fibonacci level 38.2% of the upward correction to the fall from the highs of the last few years near 76.80 to support level near 42.15), then long-term short positions with targets at support levels 50.30 (Fibonacci level 23.6%), 42.15 (Fibonacci level 0% and minimums of December 2018) will be relevant.

Only the return of prices to the zone above the level of 59.90 will resume the bull trend.

Support Levels: 55.40, 50.30, 42.15

Resistance Levels: 56.85, 59.00, 59.50, 59.90, 60.90


Trading Scenarios


Sell Stop 54.50. Stop Loss 56.90. Take-Profit 50.30, 43.00

Buy Stop 57.10. Stop-Loss 55.30. Take-Profit 59.00, 59.50, 59.90, 60.90, 61.50, 61.85, 63.50, 64.40, 66.50

310519-WTI-W.png


310519-WTI-D.png


*) For up-to-date and detailed analytics and news on the forex market visit Tifia Forex Broker website tifia.com
 
AUD/USD: RBA may announce another 2 rate cuts

03/06/2019

Current dynamics


The Australian dollar and the AUD / USD pair are rising on Monday, despite the fact that on Tuesday a meeting of the RB of Australia will be held, at which the bank is expected to reduce the interest rate by 0.25% to 1.25%.

Moreover, many economists believe that the RBA may announce 2 more rate cuts this year, given the uncertain situation in the global economy and its potential impact on Australian GDP growth.

However, investors are selling the US dollar, which gives a positive impetus to dollar pairs.

Anxiety does not leave investors, and world stock indices continue to decline after last week, US President Donald Trump threatened Mexico with the introduction of import duties on its products, unless the authorities of this country take measures to prevent illegal immigration to the US.

“Mexico sent a large delegation for border talks. The problem is that they "say" 25 years. We need action, not talk. If they wanted to, they would solve the problem of the border in one day”, Trump tweeted on Sunday.

The RBA meeting will end with the publication of the interest rate decision on Tuesday (04:30 GMT).

As previously stated by the Governor of the Reserve Bank of Australia, Philip Lowe, "new incentives could help accelerate economic growth". Recent labor market data was weak, and “to accelerate inflation, an unemployment rate below 5% is needed”, Lowe added.

The perspective of reducing the RBA rate by 0.5% or more percent creates pressure on the Australian currency.

As soon as investors again pay attention to the American dollar, the AUD / USD pair will turn back "to the south". The US dollar looks preferable to other currencies due to the greater stability of the American economy.

Despite the current correctional growth, AUD / USD remains in a long-term bearish trend.

Below the key resistance levels of 0.7095 (EMA144 on the daily chart), 0.7148 (EMA200 on the daily chart) short positions remain preferable.

When the price reaches the resistance level of 0.7000 (ЕМА50 and the upper line of the downward channel on the daily chart), it is recommended to resume or increase sales with stops 20-30 points higher than this mark.

The immediate goal of the decline is located at 0.6830 (2016 lows).

Support Levels: 0.6923, 0.6900, 0.6830, 0.6800

Resistance Levels: 0.6973, 0.7000, 0.7095, 0.7148


Trading Scenarios


Sell in the market. Stop Loss 0.7020. Take-Profit 0.6923, 0.6900, 0.6830, 0.6800

Buy Stop 0.7020. Stop Loss 0.6960. Take-Profit 0.7095, 0.7148

030619-AU-D.png


*) For up-to-date and detailed analytics and news on the forex market visit Tifia Forex Broker website tifia.com
 
EUR/USD: Current Dynamics

04/06/2019


The US dollar continues to decline on Tuesday, under pressure from the heightened expectations of lower Fed interest rates. President of the Federal Reserve Bank of St. Louis and a member of the Federal Open Market Operations Committee James Bullard said Monday that "a reduction in rates may be appropriate soon" to support the economy and accelerate inflation. According to him, "the slowdown may be more dramatic than expected, due to the continuing uncertainty in the conditions of world trade".

On Tuesday, DXY futures dropped to 97.00. Investors are moving away from the risks that have intensified due to the aggravation of the US-China and USA-Mexico trade confrontation, preferring gold, yen, and government bonds. Thus, the yield on 10-year US government bonds fell on Monday to 2.075%, to the marks of September 2017.

At the same time, investors assess the risks and prospects for the direction of further movement of both the dollar and the euro, on the eve of the ECB meeting on Thursday.

The uncertainty associated with Brexit, the situation in Italy, makes investors cautious about the likelihood of further strengthening of the euro.

If the rhetoric of the statements of the management of the ECB is soft in relation to its monetary policy, the euro may decline, including in relation to the dollar.

At the beginning of the European session on Tuesday, EUR / USD is trading near the 1.1250 mark, 10 points higher than the opening price of the trading day. The current growth of the Eurodollar is associated more with the weakening of the dollar and the correction, rather than with the strengthening of the euro.

EUR / USD is in a steady bearish trend.

Below the resistance levels of 1.1285 (Fibonacci level 23.6% of the correction to the fall from the level of 1.3900, which began in May 2014), 1.1315 (EMA144), 1.1365 (EMA200 on the daily chart), long-term negative dynamics prevail.

The signal for the resumption of short positions will be the return of EUR / USD to the zone below the support level of 1.1210 (ЕМА50 on the daily chart) with the likelihood of further falling of EUR / USD with targets located at support levels of 1.1125, 1.1100, 1.1000.

Support Levels: 1.1210, 1.1195, 1.1180, 1.1125, 1.1100, 1.1000

Resistance Levels: 1.1285, 1.1315, 1.1365


Trading Recommendations


Sell Stop 1.1235. Stop Loss 1.1290. Take-Profit 1.1210, 1.1195, 1.1180, 1.1125, 1.1100, 1.1000

Buy Stop 1.1290. Stop Loss 1.1235. Take-Profit 1.1315, 1.1365

040619-DXY.png


040619-EU-D.png


040619-EU-H4.png


*) For up-to-date and detailed analytics and news on the forex market visit Tifia Forex Broker website tifia.com
 
XAU/USD: Current Dynamics

05/06/2019


On Wednesday, gold rises in price for the 5th day in a row. The XAU / USD pair is trading at the beginning of the European session near the mark of 1336.00, 130 points above the support level of 1323.00 (January and March highs), but 80 points ($ 8) below the local resistance level of 1346.00 (multi-monthly and annual highs).

While XAU / USD is above the key support level of 1277.00 (Fibonacci level of 61.8% of the correction to the wave of decline since July 2016 and EMA200 on the daily chart), the bullish trend remains.

There is a strong positive impulse that supports XAU / USD and it emerged after a sharp weakening of the dollar, aggravating trade contradictions between the US and China, and Mexico, as well as after yesterday’s speech by Fed Chairman Jerome Powell. He said that the Fed, if necessary, will take "appropriate measures to support growth" of the economy.

Usually, when the Fed raises the interest rate, the price of gold decreases as the cost of its acquisition and storage increases. With the easing of the monetary policy of the Fed and the growing uncertainty in the financial markets, the demand for gold and its price increase.

An alternative scenario implies a resumption of dollar growth and a decline in XAU / USD to a key support level of 1277.00.

The signal for the development of this scenario will be the breakdown of the short-term support level of 1323.00 (EMA200 on the 15-minute chart and the highs of January, March). Farther targets for the decline are at support levels of 1197.00 (November lows), 1185.00 (Fibonacci level 23.6%), 1160.00 (2018 lows).

Support Levels: 1323.00, 1310.00, 1302.00, 1291.00, 1282.00, 1277.00, 1268.00, 1248.00

Resistance Levels: 1346.00, 1357.00, 1365.00, 1370.00


Trading Scenarios


Sell Stop 1322.00. Stop-Loss 1340.00. Take-Profit 1310.00, 1302.00, 1291.00, 1282.00, 1277.00, 1268.00, 1248.00

Buy Stop 1340.00. Stop Loss 1322.00. Take-Profit 1346.00, 1357.00, 1365.00, 1370.00

050619-10-Y.png


050619-XU-W.png


050619-XU-D.png


*) For up-to-date and detailed analytics and news on the forex market visit Tifia Forex Broker website tifia.com
 
EUR/USD: Current Dynamics

06/06/2019


As expected by many market participants, the European Central Bank on Thursday left interest rates unchanged. In a statement following the meeting on Thursday, the ECB confirmed its intention to leave the key rate at the current level of -0.40% at least until the end of the year and continue to reinvest the income from bonds into the debt portfolio.

The euro reacted quite restrained to this news, while the EUR / USD pair rose only by 38 points, to the level of 1.1272.

Now market participants will closely follow the speech of the ECB President Mario Draghi at the press conference, which will begin at 12:30 (GMT). Draghi will present new forecasts by ECB economists, which may reflect lower expectations for economic growth next year. He will also present the conditions of a new long-term lending program for banks.

With the escalation of risks to the global economy, the uncertainties associated with Brexit and the situation in Italy and after the recent elections to the European Parliament, Mario Draghi can still allow the ECB’s softer monetary policy to be possible in its speech.

If he gives a signal in this direction, the euro may sharply decline, despite its restrained reaction after the ECB published its decision on interest rates.

Also at this time (12:30 GMT) data on the balance of foreign trade, non-agricultural labor productivity and applications for unemployment benefits in the United States will be published. Positive statistics from the US can give a positive impetus to the dollar and negatively affect the dynamics of EUR / USD. And, conversely, weak macro data from the United States will put pressure on the dollar.

Meanwhile, after the publication of the ECB decision, the DXY dollar index dropped another 18 points to 97.00, while the EUR / USD pair is trading near the 1.1262 mark.

Below the resistance levels of 1.1285 (Fibonacci level 23.6% of the correction to the fall from the level of 1.3900, which began in May 2014), 1.1315 (EMA144), 1.1365 (EMA200 on the daily chart), long-term negative dynamics prevail.

After the breakdown of the local support level of 1.1200, a further weakening of EUR / USD with targets located at the support levels of 1.1125, 1.1100, 1.1000 is likely.

Support Levels: 1.1200, 1.1180, 1.1125, 1.1100, 1.1000

Resistance Levels: 1.1285, 1.1315, 1.1365


Trading recommendations


Sell Stop 1.1190. Stop Loss 1.1280. Take-Profit 1.1180, 1.1125, 1.1100, 1.1000

Buy Stop 1.1280. Stop-Loss 1.1190. Take-Profit 1.1315, 1.1365

060619-DXY.png


060619-EU-D.png


060619-EU-H4.png


*) For up-to-date and detailed analytics and news on the forex market visit Tifia Forex Broker website tifia.com
 
EUR/USD: Current Dynamics

06/07/2019


Last Thursday, the ECB, as is well known, kept its monetary policy unchanged, leaving key interest rates unchanged.

During the press conference, ECB President Mario Draghi said that the ECB is “ready to act and use all the tools at its disposal”, hinting that the bank is ready to lower rates or take other measures if necessary.

Nevertheless, the EUR / USD pair rose, and the euro peaked from April 17 after the ECB meeting.

Many economists believe that if the Fed starts to soften the policy, the ECB will probably do the same. Probably already in July, the ECB will announce a rate cut, if the Fed also softens the policy.

On Friday, the euro and the EUR / USD pair are falling, and the dollar strengthens on the eve of the publication (at 12:30 GMT) of data from the US labor market. According to the forecast, in May, 180,000 new jobs were created in the American economy, while unemployment remained at 3.6%. If the data turns out to be weaker than the predicted values, then the dollar may briefly, but drop sharply.

During this period, a surge in volatility is expected. In the event of a breakdown of the short-term support level of 1.1220 (EMA200 on the 1-hour chart), EUR / USD will return to a bearish trend. The first signal for this will be the breakdown of the short-term support level of 1.1258 (EMA200 on the 15-minute chart, EMA50 on the 1-hour chart) with targets located at the support levels of 1.1125, 1.1100, 1.1000.

Below the key resistance levels of 1.1285 (Fibonacci level 23.6% of the correction to the fall from the level of 1.3900, which began in May 2014), 1.1310 (EMA144), 1.1365 (EMA200 on the daily chart) the bearish EUR / USD trend prevails.


Support Levels: 1.1258, 1.1220, 1.1180, 1.1125, 1.1100, 1.1000

Resistance Levels: 1.1285, 1.1310, 1.1365


Trading Recommendations


Sell Stop 1.1250. Stop Loss 1.1290. Take-Profit 1.1220, 1.1180, 1.1125, 1.1100, 1.1000

Buy Stop 1.1290. Stop Loss 1.1250. Take-Profit 1.1310, 1.1365

070619-DXY.png


070619-EU-D.png


070619-EU-M15.png


*) For up-to-date and detailed analytics and news on the forex market visit Tifia Forex Broker website tifia.com
 
S&P500: Current Dynamics

10/06/2019


US stocks indices rose from the opening of today after last Friday they ended the week as one of the best weeks in the last 6 months. DJIA added 4.7%, S&P500 - 4.4%, and Nasdaq - 3.9%.

The heightened expectations of the Fed's policy easing led to an increase in US stock indices, which continued to recover from a sharp drop last month amid growing risks of escalating international trade wars.

Fed Chairman Jerome Powell said last Tuesday that the Fed "will act according to the need to maintain growth". The worsening economic outlook strengthens the pressure on the Fed leadership towards easing monetary policy, which leads to an increase in US stock indices.

At the beginning of the European session, S&P500 futures traded near the 2884.0 mark, above the important short-term support level of 2840.0 (EMA50 on the daily chart, EMA200 on the 4-hour chart).

Above key support levels of 2810.0 (Fibonacci level 23.6% of the correction to the growth since December 2018 and the level of 2335.0), 2800.0 (EMA144), 2781.0 (EMA200 on the daily chart), the bullish trend prevails.

The signal for the resumption of sales will be the return of the S&P500 to the zone below the support level of 2840.0. After the breakdown of the key support level of 2781.0, the targets for further reduction of the S&P500 will be the support levels of 2720.0 (Fibonacci 38.2%), 2645.0 (Fibonacci 50%), 2510.0 (EMA200 on the weekly chart).

Support Levels: 2858.0, 2840.0, 2810.0, 2800.0, 2781.0, 2720.0, 2645.0, 2573.0, 2507.0

Resistance Levels: 2915.0, 2937.0, 2959.0


Trading recommendations


Sell Stop 2856.0. Stop Loss 2910.0. Objectives 2840.0, 2810.0, 2800.0, 2781.0, 2720.0, 2645.0, 2573.0, 2507.0

Buy Stop 2910.0. Stop Loss 2856.0. Objectives 2915.0, 2937.0, 2959.0

100619-s500-D.png


100619-s500-H4.png


*) For up-to-date and detailed analytics and news on the forex market visit Tifia Forex Broker website tifia.com
 
AUD/USD: Current Dynamics

11/06/2019


Last week, the Reserve Bank of Australia lowered its key interest rate by 0.25% to 1.25%. This is the first rate reduction since 2016.

Governor of the Reserve Bank of Australia, Philip Lowe, said that the key rate will be reduced to 1% by the end of this year. "The likelihood of lowering interest rates is still not excluded", said Lowe, hinting at the possibility of a further reduction in interest rates. This is a strong negative fundamental factor for the Australian dollar, which continues to decline in the foreign exchange market.

RBA leaders called increased uncertainty in world trade a risk to the Australian economy. By lowering the interest rate, the RBA is trying to accelerate GDP growth, reduce unemployment to 5%, and accelerate inflation.

Meanwhile, the situation in global financial markets is gradually calming down after last Friday Donald Trump tweeted that the imposition of duties on goods from Mexico has been canceled, so far.

Investors are gradually emerging from defensive assets, acquiring more profitable, but also more risky assets of the stock market. The demand for the dollar is also growing, despite expectations that the Fed will cut interest rates.

At the beginning of the European session, the DXY dollar index futures traded near the 96.72 mark, 14 points higher than the opening price of the current week, and the AUD / USD pair - near the 0.6955 mark.

Now investors will follow the publication on Thursday (01:30 GMT) data from the Australian labor market. If they turn out to be worse than the forecast or weaker than the previous values, then AUD will accelerate the decline. A positive report on the labor market will support AUD.

AUD / USD remains in a long-term bearish trend.

Below the key resistance levels of 0.7085 (EMA144 on the daily chart), 0.7140 (EMA200 on the daily chart) negative dynamics prevail.

Breakdown of short-term support levels of 0.6974 (EMA200 on 4-hour chart), 0.6962 (EMA200 on 1-hour chart) speaks in favor of further reducing AUD / USD with reduction targets located at support levels of 0.6900, 0.6830 (2016 lows), 0.6770.

Support Levels: 0.6900, 0.6830, 0.6800, 0.6770

Resistance Levels: 0.6962, 0.6974, 0.7000, 0.7085, 0.7140


Trading Scenarios


Sell in the market. Stop Loss 0.7025. Take-Profit 0.6900, 0.6830, 0.6800, 0.6770

Buy Stop 0.7025. Stop Loss 0.6940. Take-Profit 0.7085, 0.7140

110619-AU-D.png


110619-AU-H4.png


*) For up-to-date and detailed analytics and news on the forex market visit Tifia Forex Broker website tifia.com
 
EUR/USD: Current Dynamics

13/06/2019


EUR / USD failed to develop an upward correction above the resistance level of 1.1310 (EMA144 on the daily chart).

On Wednesday, EUR / USD resumed its decline after the publication at the beginning of the American session of positive macro statistics from the United States, indicating a modest, but still rising inflation in the United States.

As the US Department of Labor reported on Wednesday, consumer prices in May increased compared to April, but less significantly than expected (in annual terms, +1.8% against the forecast of +1.9% and +2.0% in April). The base consumer price index, which does not take into account food and energy, rose by 2% compared with May 2018, compared with the expected growth of 2.1%.

Next week, the Fed decides on rates. Published statistics are unlikely to give the Fed a reason to lower rates, although it may signal a decrease in rates in the second half of this year.

Meanwhile, EUR / USD has remained in the global downtrend since May 2014.

At the beginning of the European session on Thursday, EUR / USD is trading near support levels of 1.1285 (Fibonacci level 23.6% of the correction to the fall from 1.3900, which began in May 2014), 1.1278 (EMA200 on the 1-hour chart).

Breakdown of these support levels will accelerate the EUR / USD decline towards annual lows near the support level of 1.1125.

Negative dynamics prevails; short positions are preferred.

Support Levels: 1.1285, 1.1278, 1.1232, 1.1180, 1.1125, 1.1100, 1.1000

Resistance Levels: 1.1310, 1.1365


Trading recommendations


Sell Stop 1.1270. Stop-Loss 1.1320. Take-Profit 1.1232, 1.1180, 1.1125, 1.1100, 1.1000

Buy Stop 1.1320. Stop Loss 1.1270. Take-Profit 1.1365

130619-EU-D.png


130619-EU-H1.png


*) For up-to-date and detailed analytics and news on the forex market visit Tifia Forex Broker website tifia.com
 
WTI: Current Dynamics

14/06/2019


Despite the rise on Thursday, during the Asian session on Friday, oil prices again resumed their decline. Investors are concerned about weakening demand and increasing oversupply in the United States. Last Tuesday, in the monthly report, the Energy Information Administration (EIA) lowered its forecast for oil demand growth to 1.2 million barrels per day, or 15% from the previous month, due to concerns about a slowdown in global economic growth.

The trade conflict between the US and China, the threat to the growth of the world economy and oil demand, as well as the growth of US oil reserves (oil reserves in the country rose to 485 million barrels, the maximum since July 2017) contribute to the increase in the negative trend in the oil market.

Participants in the oil market also believe that the situation with the attack on tankers could be another geopolitical fear.

If a deal to reduce oil production by OPEC + (OPEC meeting is scheduled for the end of June) is not extended, the fall in oil prices may accelerate.

On Friday at 17:00 (GMT), the American oilfield services company Baker Hughes will present a weekly report on the number of active drilling rigs in the United States. At the moment, their number is 789 units.

If the report indicates an increase in the number of such installations, this may give an additional negative impetus to prices.

*)An advanced fundamental analysis is available on the Tifia Forex Broker website at tifia.com/analytics

At the beginning of the European session, WTI crude oil is quoted at $52.00 per barrel, below the important resistance levels of 59.50 (50% Fibonacci level), 59.00 (EMA200 on the daily chart), 56.85 (EMA200 on the weekly chart), 55.40 (Fibonacci level 38.2% of the upward correction to a fall from the highs of the last few years near the 76.80 mark to the level of support near the 42.15 mark).

Mostly negative dynamics. Long-term targets are located near the 42.15 mark (lows of December 2018). Relevant short positions.

Support Levels: 50.30, 49.00, 42.15

Resistance Levels: 53.25, 55.40, 56.85, 59.00, 59.50


Trading Recommendations


Sell in the market. Stop Loss 53.50. Take-Profit 50.30, 49.00, 43.00

Buy Stop 53.50. Stop Loss 51.50. Take-Profit 55.40, 56.85, 59.00, 59.50

140619-WTI-D.png


140619-WTI-H1.png


*) For up-to-date and detailed analytics and news on the forex market visit Tifia Forex Broker website tifia.com
 
GBP/USD: Current Dynamics

17/06/2019


Negative momentum continues to dominate the pound. Domestic political risks are added to weak macro statistics after Theresa May’s resignation from the post of prime minister and against the background of increasing likelihood of a hard Brexit. On Tuesday, the second round of voting for the candidacy of the new head of the Conservatives will take place. A favorite among 6 candidates is Boris Johnson.

The pound will also be pressured by the risk of early elections in the UK, which may take place in December.

And this week, investors will follow the meeting of the Bank of England. On Thursday (11:00 GMT) the decision of the Bank of England on the rate will be published. Probably, the rate will remain unchanged, at the level of 0.75%. However, volatility may rise sharply in the foreign exchange market if unexpected statements are made by the management of the Bank of England. Signals in favor of tightening monetary policy, which, however, is unlikely in the current situation, will cause a sharp short-term strengthening of the pound.

However, below the key resistance levels of 1.2970 (ЕМА200 on the daily chart), 1.3210 (Fibonacci level 23.6% of the correction to the decline of the GBP / USD pair in the wave that started in July 2014 near the level of 1.7200) long-term negative dynamics prevail.

Still, short positions are preferred.

Support Levels: 1.2480

Resistance Levels: 1.2600, 1.2670, 1.2700, 1.2765, 1.2800


Trading Recommendations


Sell in the market. Stop Loss 1.2620. Take-Profit 1.2480

Buy Stop 1.2620. Stop Loss 1.25800. Take-Profit 1.2670, 1.2700, 1.2765, 1.2800

170619-GU-D.png


170619-GU-H4.png


*) For up-to-date and detailed analytics and news on the forex market visit Tifia Forex Broker website tifia.com
 
AUD/USD: Current Dynamics

06/18/2019


As follows from the minutes published on Tuesday (01:30 GMT) from the meeting of the RBA, held on June 4, the bank's management signaled a tendency to further easing of monetary policy. Governor of the Reserve Bank of Australia, Philip Lowe, stated that "there is reason to expect a lower key rate". According to the leaders of the central bank, unemployment should fall from the current level of 5.2% to 4.5% in order for inflation to accelerate to the target range of 2% -3%.

Many economists predict two or more rate cuts this year and a key rate reaching a record minimum of 0.75%.

This is a strong fundamental factor in favor of further weakening AUD.

Meanwhile, the attention of financial market participants is shifted to the 2-day Fed meeting, which will end on Wednesday with the publication (at 18:00 GMT) of the interest rate decision. Probably, the rate will remain at the same level of 2.5%. However, signals from the leadership of the Fed in favor of lowering the rate by the end of this year will put downward pressure on the dollar. At the same time, the demand for the US dollar is likely to save.

The US economy looks more resilient in international trade conflicts.

AUD / USD continues to decline, remaining in a long-term bearish trend since July 2014. The lows of the last wave of decline are located near the mark of 0.6830. A strong negative impulse prevails in anticipation of a further reduction in the RBA interest rate. The immediate goal of the decline is located at around 0.6770 (2019 lows).

Below the key resistance levels of 0.7070 (EMA144 on the daily chart), 0.7125 (EMA200 on the daily chart) short positions remain preferable.

Support Levels: 0.6830, 0.6800, 0.6770

Resistance Levels: 0.6865, 0.6910, 0.6955, 0.6980, 0.7000, 0.7070, 0.7125


Trading Recommendations


Sell in the market. Stop Loss 0.6880. Take-Profit 0.6830, 0.6800, 0.6770

Buy Stop 0.6880. Stop Loss 0.6820. Take-Profit 0.6910, 0.6955, 0.6980, 0.7000

180619-AU-D.png


180619-AU-H1.png


*) For up-to-date and detailed analytics and news on the forex market visit Tifia Forex Broker website tifia.com
 
EUR/USD: Current Dynamics

19/06/2019


Since May 2014, EUR / USD remains in the global downtrend. At the beginning of the European session on Wednesday, EUR / USD is trading near the 1.1200 mark, below resistance levels 1.1230 (EMA200 on the 4-hour chart), 1.1243 (EMA200 on the 1-hour chart).

The focus of traders on Wednesday is the publication (at 18:00 GMT) of the Fed decision on rates. It is expected that the rate will remain at the same level of 2.5%. Nevertheless, many financial market participants are waiting for signals from the Fed about the possibility of lowering the rate.

At 18:30 (GMT), the Fed’s press conference will begin. Market participants will analyze the statements of the Fed Chairman to understand how likely a decrease in the rate is in July. The soft tone of the statement and press conference or direct signals aimed at easing monetary policy will cause an increase in stock indices and a fall in the dollar, including against the euro.

The soft monetary policy of the central bank usually contributes to the cheapening of the national currency.

In the current situation, technical analysis fades into the background. Probably the most cautious investors would prefer to stay out of the market during this time period.

Breakdown of the local support level of 1.1180 will accelerate the EUR / USD decline towards annual lows near the support level of 1.1125.

If the Fed announces a rate cut, at least later this year, the dollar will decline and the EUR / USD pair will go towards resistance levels of 1.1285 (Fibonacci level 23.6% of the correction to a fall from the level of 1.3900, which began in May 2014), 1.13050 (EMA144 on the daily chart). Below these levels, negative dynamics prevail; short positions still look better.

Support Levels: 1.1180, 1.1125, 1.1100, 1.1000

Resistance Levels: 1.1230, 1.1243, 1.1285, 1.1305, 1.1355


Trading Recommendations


Sell Stop 1.1170. Stop Loss 1.1250. Take-Profit 1.1125, 1.1100, 1.1000

Buy Stop 1.1250. Stop Loss 1.1170. Take-Profit 1.1285, 1.1305, 1.1355

190619-EU-H4.png


190619-EU-D.png


*) For up-to-date and detailed analytics and news on the forex market visit Tifia Forex Broker website tifia.com
 
USD/JPY: Current Situation

20/06/2019


USD / JPY resumed its decline after the Fed meeting ended on Wednesday. As you know, on Wednesday, the Fed kept its monetary policy unchanged. Fed Chairman Jerome Powell said that "the committee (FOMC) wants a clearer picture of the economic situation". At the same time, Powell also said that "the arguments in favor of additional policy easing were strengthened". This statement was considered by investors as a signal to the Fed rate cut soon, and the dollar fell on sales.

On Thursday, the management of the Bank of Japan decided to leave the target level of yield on 10-year Japanese bonds around zero, and the short-term deposit rate at -0.1%.

At the same time, the bank promised to maintain the current extra-soft monetary policy at least until the spring of 2020.

However, this did not prevent further decline of the USD / JPY pair.

In the event of a breakdown of the support level of 107.00, the targets for further decline will be the support levels of 106.50 (Fibonacci level 23.6% of the pair’s fall correction from the level of 125.65 that began in June 2015), 104.70 (2018 lows).

A strong negative dynamic prevails. Short positions are preferred.

Support Levels: 107.30, 107.00, 106.50, 105.00, 104.70

Resistance Levels: 108.35, 108.80, 109.15, 109.70, 110.15, 110.50


Trading scenarios


Buy Stop 108.40. Stop Loss 107.40. Take-Profit 108.80, 109.15, 109.70, 110.15, 110.50

Sell Stop 107.40. Stop Loss 108.40. Take-Profit 107.00, 106.50, 105.00, 104.70

230119-UJ-D.png


230119-UJ-H4.png


*) For up-to-date and detailed analytics and news on the forex market visit Tifia Forex Broker website tifia.com
 
WTI: price increase is corrective in nature

06/21/2019

Current Dynamics


Since the opening of today's trading day, WTI crude oil has been trading in a narrow range near the mark of 57.00 dollars per barrel. One of 3 key resistance levels (EMA200 on the weekly chart) passes through this mark. Below this level and resistance levels of 59.50 (Fibonacci level 50% of the upward correction to a fall from the highs of the last few years near the 76.80 mark to the support level near the 42.15 mark), 59.00 (EMA200 on the daily chart) is dominated by a long-term negative dynamic.

The current increase in the price of oil, which is observed this week, so far can be described as corrective, provoked by a number of fundamental factors.

This is the growth of geopolitical tensions in the Middle East, as well as the weakening of the dollar, occurring against the backdrop of the Fed's statements about the increased likelihood of monetary easing. After last week two oil tankers were attacked in the Gulf of Oman, on Thursday, US officials reported a missile attack on a desalination plant in Saudi Arabia, which was allegedly inflicted from Yemen. Later, the Islamic Revolutionary Corps announced that it had shot down an American reconnaissance drone over Iranian territory. The United States on Thursday announced preparations for a retaliatory strike on Iran.

Earlier, the Iranian authorities have repeatedly threatened to close the Strait of Hormuz, if US sanctions against Iran are not lifted.

The increased risk of oil supply disruptions from the Middle East, coupled with a weaker dollar, led to a sharp rise in oil prices this week.

On Friday, oil market participants will follow the publication at 17:00 (GMT) of a weekly report on the number of active drilling rigs in the United States from the American oilfield services company Baker Hughes. If the report again indicates a decrease in the number of such installations (788 units at the moment), this may give an additional positive impetus to prices.

Nevertheless, it is premature to consider price growth above key resistance levels 59.00, 59.50.

Below these resistance levels, a long-term bearish trend prevails.

*)An advanced fundamental analysis is available on the Tifia Forex Broker website at tifia.com/analytics


Trading recommendations

At the beginning of the European session, WTI crude oil is priced at $ 57.00 per barrel, below the important resistance levels of 59.50 (Fibonacci 50% of the upward correction to a fall from the highs of the past few years near 76.80 to the support near 42.15), 59.00 (EMA200 on the daily chart).

The signal for the resumption of sales will be the breakdown of support levels of 56.40 (EMA200 on 4-hour chart), 55.40 (Fibonacci 38.2%) with long-term goals located near the support level of 42.15 (Fibonacci 0% and lows of December 2018).

Support Levels: 56.40, 55.40, 54.10, 53.25, 50.30, 49.00, 42.15

Resistance Levels: 57.00, 59.00, 59.50


Trading recommendations


Sell Stop 55.30. Stop Loss 57.80. Take-Profit 54.10, 53.25, 50.30, 49.00, 42.15

Buy Stop 57.80. Stop Loss 55.30. Take-Profit 59.00, 59.50

210619-WTI-W.png


210619-WTI-D.png


210619-WTI-H4.png


*) For up-to-date and detailed analytics and news on the forex market visit Tifia Forex Broker website tifia.com
 
EUR/USD: Current Dynamics

06/24/2019


The dollar continued to decline in the first half of the trading day on Monday. At the beginning of the US session, the DXY dollar index futures, reflecting the value of the dollar to a basket of 6 major currencies, is trading near the 95.62 mark, 10 points lower than the closing price last Friday. The weekly drop in the index was the strongest since February 2018. The main driver of the dollar decline in the current situation is the expectation of a Fed rate cut soon.

Against the background of a falling dollar, the EUR / USD pair is rising after the pair reached a 3-month high on Friday near the 1.1377 mark. At the beginning of the American session, EUR / USD is trading near the 1.1390 mark after the publication (08:00 GMT) of the IFO indices for Germany, which showed that the European economy is still far away from the recovery.

EUR / USD broke through on Friday the key resistance level of 1.1355 and continues to grow towards the 1.1400 mark. The long-term goal of growth is the resistance level of 1.1600 (ЕМА200 on the weekly chart).

However, near the level of 1.1400 possible rebound.

In the case of a return to the zone below the level of 1.1355, short positions will again become relevant.

The breakdown of support levels of 1.1305 (EMA144 on the daily chart), 1.1285 (Fibonacci level 23.6% of the correction to the fall from the level of 1.3900, which began in May 2014) will confirm the return of EUR / USD to the global bearish trend.

Support Levels: 1.1355, 1.1305, 1.1285, 1.1243, 1.1180, 1.1125

Resistance Levels: 1.1400, 1.1510, 1.1600


Trading recommendations


Sell Stop 1.1340. Stop-Loss 1.1415. Take-Profit 1.1305, 1.1285, 1.1243, 1.1180, 1.1125

Buy Stop 1.1415. Stop-Loss 1.1340. Take-Profit 1.1510, 1.1600

240619-DXY.png


240619-EU-W.png


240619-EU-D.png


*) For up-to-date and detailed analytics and news on the forex market visit Tifia Forex Broker website tifia.com
 
NZD/USD: Current Dynamics

06/25/2019


NZD / USD is trying to develop an upward trend caused by the weakening of the USD. On Monday, US President Donald Trump resumed criticism of the Fed’s monetary policy actions, tweeting that "they are like a stubborn child, while we need lower rates and a softer policy to compensate for other countries’ actions against us".

Combined with Trump’s criticism, the soft rhetoric of the Fed’s leadership, and amid weak macro statistics recently coming in from the US, the US dollar has dropped significantly in the foreign exchange market. The DXY dollar index fell 1.85% last week to 95.72. The weekly drop in the index was the strongest since February 2018.

Nevertheless, the current growth of NZD / USD is more like an upward correction, rather than replacing the global downtrend with an uptrend.

Below the key resistance level of 0.6720 (EMA200 on the daily chart) a long-term bearish trend prevails, starting at 0.8820 in July 2014. In view of this, a rebound is possible from the resistance levels of 0.6685, 0.6720.

The return of NZD / USD to the zone below support level 0.6605 (EMA50 on the daily chart) will be a signal to resume sales with targets at support levels 0.6430 (2018 lows), 0.6260 (Fibonacci level 0% and lows of the global decline wave from 0.8820, which started in July 2014).

Support Levels: 0.6605, 0.6585, 0.6560, 0.6490, 0.6430, 0.6400, 0.6300, 0.6260

Resistance Levels: 0.6685, 0.6720, 0.6800, 0.6865, 0.6920


250619-DXY.png


250619-NU-D.png


250619-NU-H4.png


*) For up-to-date and detailed analytics and news on the forex market visit Tifia Forex Broker website tifia.com
 
EUR/USD: Current Dynamics

06/26/2019


The market has lowered its expectations regarding the Fed’s soon monetary easing.

Speaking at the Council on Foreign Relations in New York on Tuesday, Fed Chairman Jerome Powell said that "the central bank should not react too sharply to any economic data or short-term changes in sentiment, as this will increase the uncertainty around the outlook for the economy".

From the news for today we are waiting for the publication at 12:30 (GMT) of a block of important macro statistics from the US, which should support the dollar.

The dollar is gradually recovering previously lost positions, and the EUR / USD pair is attempting to return to the zone below 1.1355 (EMA200 on the daily chart) key level, which will mean the recovery of the long-term bearish trend of EUR / USD.

The breakthrough of the short-term support level of 1.1317 (EMA200 on the 1-hour chart) will be a signal for the resumption of sales with targets at the support levels of 1.1285 (Fibonacci 23.6% of the correction to a fall from the level of 1.3900, which began in May 2014), 1.1260 (EMA200 on the 4-hour chart), 1.1180 (minimum June), 1.1125 (minimum of a year).

An alternative scenario will be associated with the breakdown of the local resistance level of 1.1410 and further growth of EUR / USD, and the long-term growth target will be the resistance level of 1.1600 (EMA200 on the weekly chart).

Support Levels: 1.1355, 1.1317, 1.1285, 1.1260, 1.1180, 1.1125

Resistance Levels: 1.1410, 1.1510, 1.1600


Trading Recommendations


Sell Stop 1.1340. Stop-Loss 1.1415. Take-Profit 1.1317, 1.1285, 1.1260, 1.1180, 1.1125

Buy Stop 1.1415. Stop-Loss 1.1340. Take-Profit 1.1510, 1.1600

260619-EU-D.png


260619-EU-H1.png


*) For up-to-date and detailed analytics and news on the forex market visit Tifia Forex Broker website tifia.com
 
Top