• The Forex, Binary Options Forum - welcomes you to our Community!

    DigitalCashPalace Forum is dedicated to discussions about Forex, Binary Options, commodities, stocks related.

    Please take a look around, and feel free to .

RoboForex - roboforex.com

Dear traders!

This week, the RoboForex company's project called ContestFX is waiting for everyone to participate in the following competitions:

The 144th competition of "Demo Forex" has gained "full speed".
The 405th competition of "Week with CFD" has just started.
The 539th competition of "Trade Day" will start on 22.03.2023 at 12:00.
The 453rd competition of "KingSize MT5" will start on 23.03.2023 at 20:00.

It does not take much effort and time to participate in our competitions - all you need to do is to go through a simple registration procedure, after which you'll get access to any of the contests you like in just a couple of mouse clicks.

We're looking forward to your joining in and wish you good luck!

Sincerely,
RoboForex Contest
 
How To Trade the "Moving Averages Based on Fibonacci Numbers" strategy

Author : Victor Gryazin

17.03.2023-1536x864.jpg


Dear Clients and Partners,

In this article, we will look at a medium-term indicator trading strategy using multiple moving averages based on Fibonacci numbers. We will find out which indicators to set and talk about the rules for making trades.

How the strategy works

Fibonacci numbers originated with the famous Italian mathematician Leonardo of Pisa, who was better known as Fibonacci. He investigated an infinite mathematical sequence that was later named after him. In it, each successive number is equal to the sum of the previous two numbers: 0, 1, 1, 2, 3, 5, 8, 13, 21, 34, 55, 89, 144, and so on.

Dividing the previous number in the sequence by the next number gives 0.618. Dividing the previous number in the sequence by the next number through one produces 0.382. The golden ratio is based on this relationship. With the advent of exchange trading, the Fibonacci sequence began to be used in trading. Various tools based on Fibonacci numbers can be found in almost any trading platform.

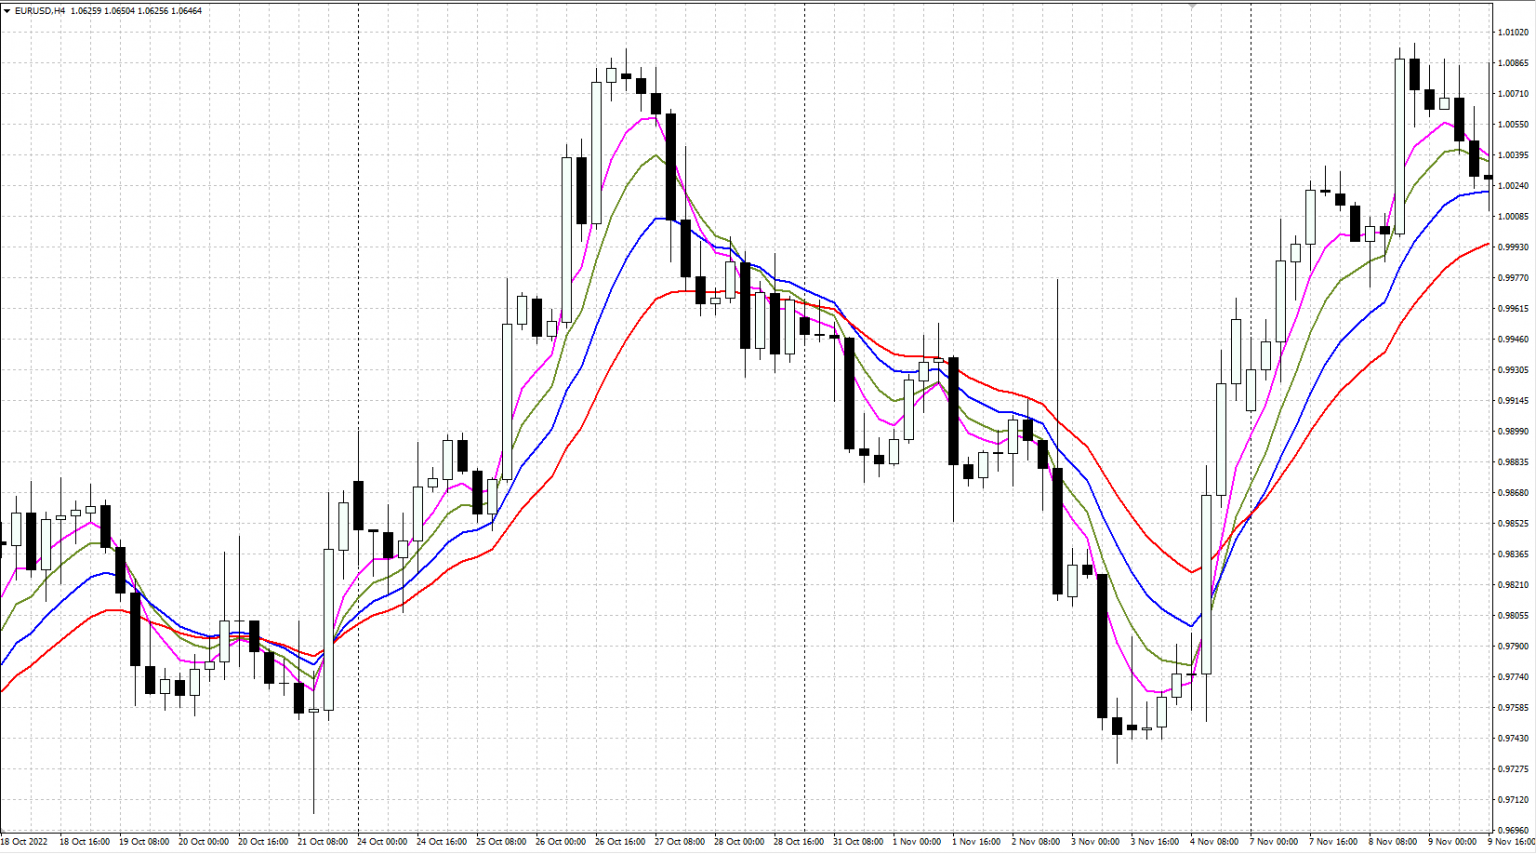
This strategy uses the intersection of four exponential moving averages (EMAs) with periods corresponding to the Fibonacci numbers (5, 8, 13, 21) to find trading signals. Moving averages have long established themselves as a simple and effective tool for trend analysis.

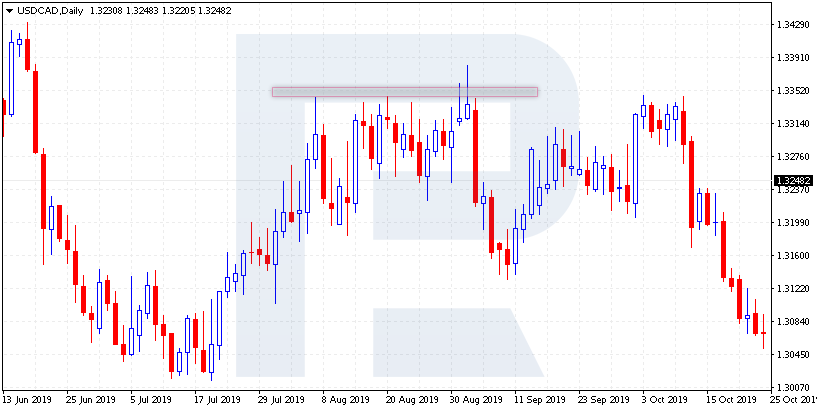
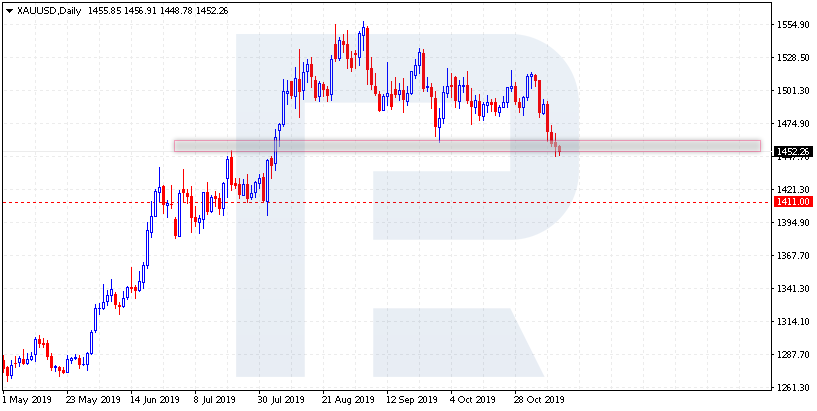
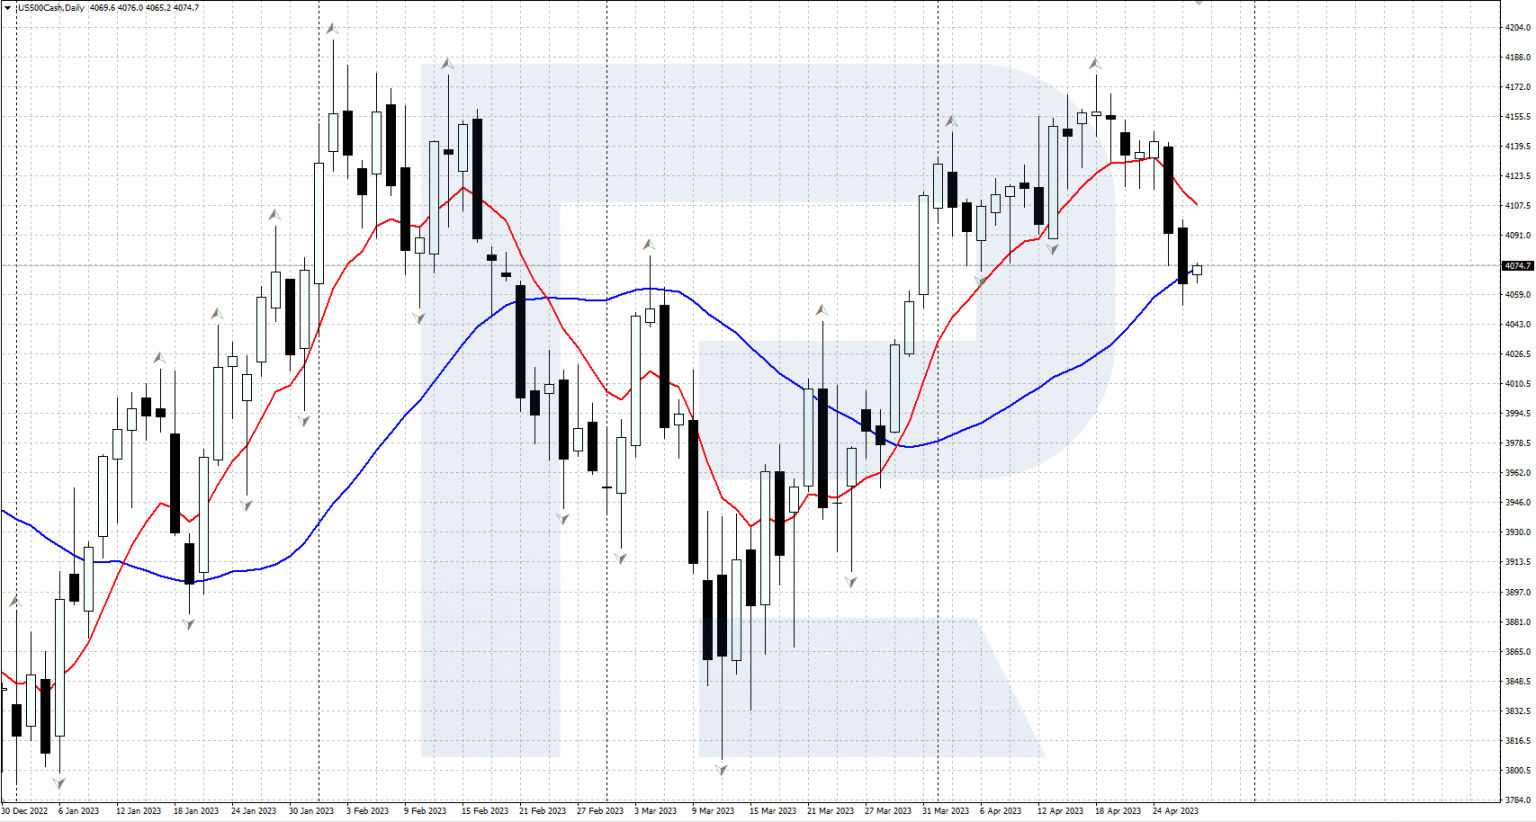
When all four moving averages are moving horizontally and intertwined, this is a sign that the market is in a sideways corridor and there is no clear trend. When the price is rising and indicator lines begin to diverge and move upwards, this signals the beginning of an uptrend. When the price decreases and the indicators diverge moving downwards, it indicates the beginning of a downtrend.

MAfibo-1-1536x854.png


How to install the Moving Average indicator

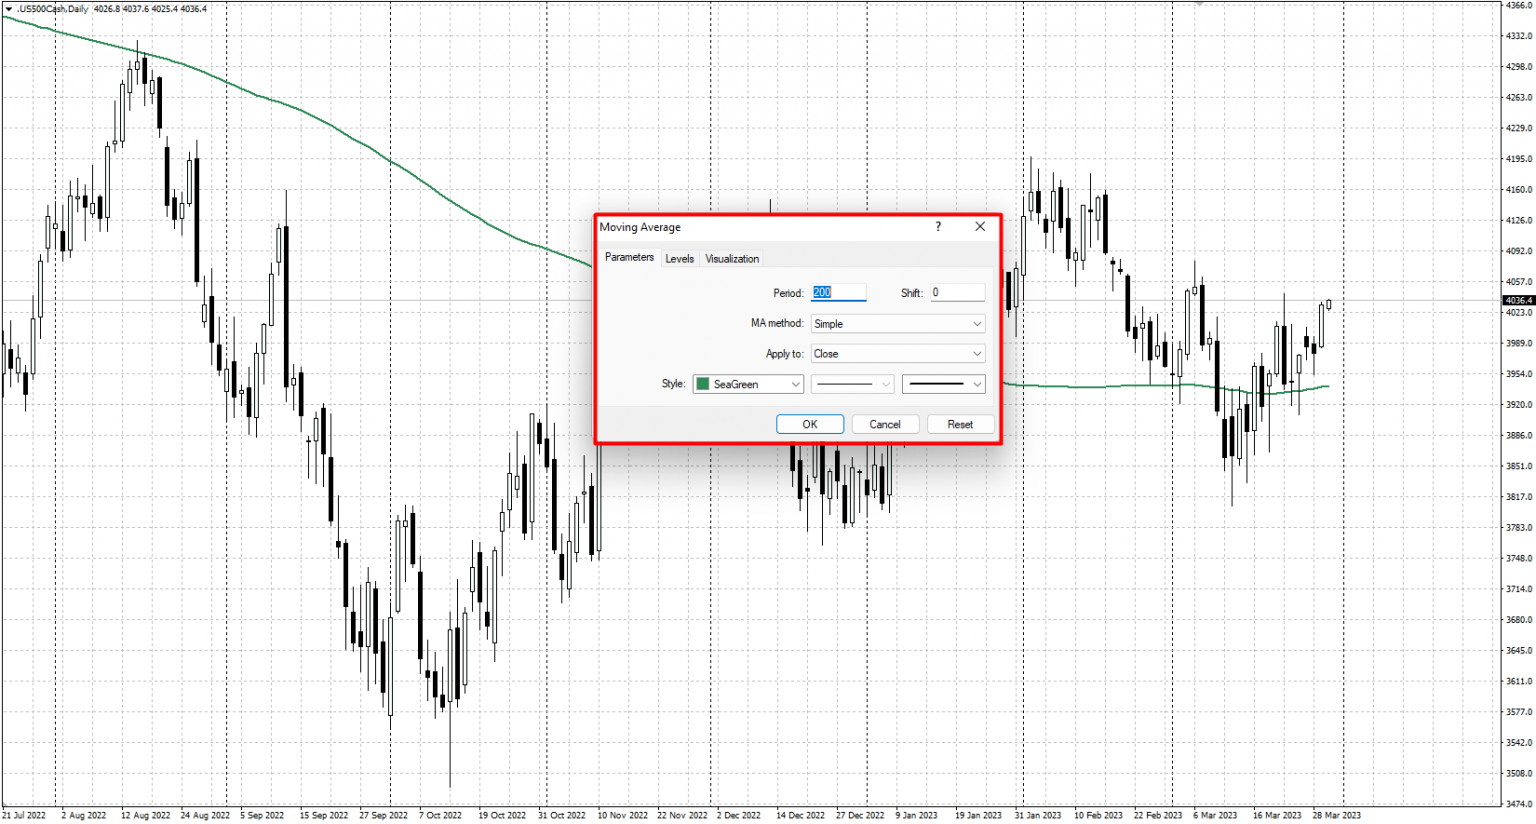
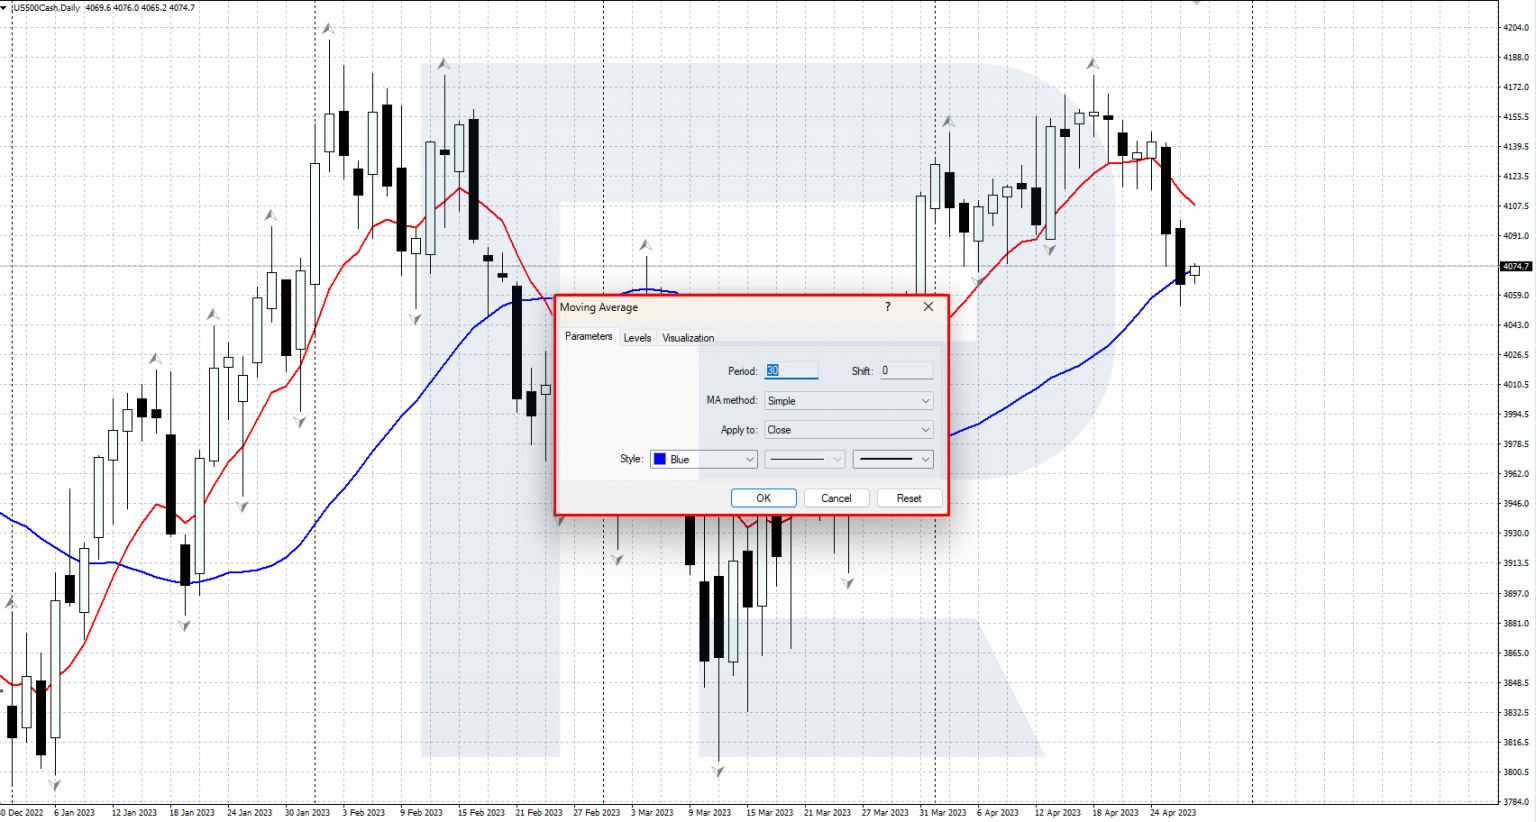
The Moving Average indicator is included in most modern trading terminals, displayed directly on the price chart. In the popular MetaTrader 4 and MetaTrader 5 trading platforms, you can install the Moving Average on the chart of the selected instrument through the Main Menu: Insert → Indicators → Trends → Moving Average.

In the window that appears, select period 5, colour and thickness of the line, and method MA: Exponential. Repeat these steps to set up three more moving averages with periods of 8, 13, and 21, selecting different colours for the indicator lines. This will result in four differently coloured moving averages on the price chart, which will be used to search for trading signals according to the strategy.

How to use the strategy in trading

This strategy is quite versatile and can be used on different timeframes and financial instruments. To trade, you have to wait for the price to move up or down out of the sideways range. In a sideways range, all four moving averages are intertwined and move horizontally – there are no trading signals.

A buy signal for the strategy
  • The price begins to rise, crossing all four moving averages from bottom to top, renewing the nearest local high
  • The moving average lines cross and begin moving upwards, gradually diverging from each other
  • A buy position is opened, and the Stop Loss is set at the nearest local low, which is below the moving averages
  • Take Profit is taken when the moving averages are crossed in the opposite direction, or when the price reverses and closes below all four moving averages
Advantages and disadvantages of the strategy

Advantages:
  • The strategy works well in trends, allowing you to profit from strong and sustained movements
  • The potential profit can be several times greater than the potential loss
Disadvantages:
  • As this strategy gives unprofitable signals during a flat period, it is better not to use it in a flat period
  • Moving signals can be slightly delayed, so a significant amount of profit can be lost on sharp market reversals
Read more at R Blog - RoboForex

Sincerely,
RoboForex team
 
RoboForex adds the Performance Fee scheme for CopyFX to the R StocksTrader app

news__rstockstrader-perfomance-fee.jpg


Dear Clients and Partners,

Here we come with a long-awaited CopyFX update on R StocksTrader: RoboForex added a new possibility for the CopyFX Traders to earn commission from their subscribers - the Performance fee.

The Performance Fee

is a commission scheme in CopyFX which allows Traders to get the share of the total amount of profit made by their subscribed Investors, so the more your subscribers earn from their copied deals - the more commission you get.

This scheme mostly suits experienced and confident Traders who demonstrate a stable performance in the medium and long run.


Why do Traders choose CopyFX in R StocksTrader?

Minimal investments
Minimal deposit of 100 USD.

High order execution speed at the same price
Instant copying of transactions with the same execution price for the Trader and the Investor guaranteed.

Comfortable app
Trade in R StocksTrader any time from any place and make a profit on commissions.

1,500+ instruments for copying
Take advantage of this unique opportunity and offer Investors more than 1,500 instruments to copy.

Copy trading is proven popular among our clients and partners. We are, therefore, constantly developing our products, enhancing them, and introducing new functions to both the desktop and mobile versions of the platform. Stay tuned for the next update!


Become a CopyFX trader in R StocksTrader now
and embrace all the benefits!


Learn more about copy trading

Sincerely,
RoboForex team
 
Dear traders!

This week, the ContestFX project brings to your attention the following demo account competitions:

The 144th competition of "Demo Forex" has reached the final stage.
The 406th competition of "Week with CFD" has just kicked off.
The 540th competition of "Trade Day" 29.03.2023 at 12:00 will start on 30.03.2023.
The 454th competition of "KingSize MT5" will start on 30.03.2023 at 20:00.

Let us remind you that all winners of our contests receive prize funds to their real accounts, which they can use to earn more in the Forex market without investing their own savings as the starting deposit.

Join us!

Sincerely,
RoboForex Contest
 
How To Trade the On Neck Candlestick Pattern

Author : Victor Gryazin

22.03.2023-1536x864.jpg


Dear Clients and Partners,

In this review, we will get acquainted with the trend continuation candlestick pattern called "On Neck”. We will look at the features of its formation and the trading rules for its application. We will learn its main advantages and disadvantages, and also list a few important recommendations for its use.

How the On Neck pattern is formed

The "On Neck" candlestick pattern is a pattern that indicates a further continuation of the current trend. It is rarely seen on price charts. It consists of two candlesticks: the first has a large body pointing in the direction of the current trend, and the second has a small body. They are always of different colours: if the first candlestick is white, the second is black, and vice versa.

The feature of this model is that the second candlestick opens with a gap in the direction of the trend and then closes the gap with its body. The closing prices of the two candlesticks should be about the same. The first candlestick symbolises the "body", the second one is the "head", and the line connecting them and passing through the closing prices is the "neck", hence the name of the pattern.

The appearance of a small black candlestick after a large white candlestick in an uptrend indicates that the "bulls" have met temporary resistance, and when overcoming it, will be able to continue to move upwards. The appearance of a small white candlestick after a large black one in a downtrend indicates temporary support, through which the "bears" are likely to continue the downward movement.

Bullish "On neck" pattern

This is formed during an uptrend when there is an active upward price movement. The first candlestick of the pattern (large white) appears first, and then the second candlestick opens with a gap upwards. The "bears", trying to seize the initiative, return the quotations to the closing price of the first candlestick. The second candlestick (small black) absorbs the gap with its body, with the closing prices of the two candlesticks approximately coinciding.

A bullish continuation of the "On neck" pattern is formed on the chart. We must now wait for confirmation that the "bulls" are still strong enough to overcome the temporary resistance of the "bears". A further rise in quotations above the high of the pattern’s second candlestick will confirm this. This upward movement will mean that the buyers are still very strong, and the uptrend is likely to continue.

OnNeckLine-1.png


How to buy using the bullish on neck pattern
  • During an uptrend, a bullish "On Neck" pattern is formed on the price chart
  • It is recommended to open a buy position when the price rises above the maximum of the second candlestick in the pattern (small black candlestick). Stop Loss is set at the low of the first candlestick (large white)
  • To set Take Profit, you can focus on significant support and resistance levels
How to sell using the bearish on neck pattern
  • During a downtrend, a bearish "On Neck" pattern is formed on the price chart
  • It is recommended to open a sell position after the price decreases below the low of the second candlestick in the pattern (small white). Stop Loss is set at the high of the first candlestick (big black candlestick)
  • To set Take Profit, you can focus on significant support and resistance levels
Recommendations for the use of the pattern in trading
  • The pattern should be formed in a pronounced upward or downward trend – it is not traded in a sideways trend
  • Wait for a confirmation – an update of the pattern’s high/low – before opening a trade
  • To increase efficiency, the model can be used in conjunction with technical analysis tools
  • It is best to use higher time frames, from H4 and above
  • It is necessary to follow the rules of risk management and place protective stop-loss orders
Read more at R Blog - RoboForex

Sincerely,
RoboForex team
 
False Breakouts on Financial Markets: How to Detect and Use?

Author : Andrey Goilov

false-breakdown.png


Dear Clients and Partners,

Hi everyone, today I'm going to talk about false breakouts. In certain cases, it might be unclear to the trader whether there has happened a breakout of the resistance level and, hence, the bullish trend will continue. Such a breakout might be false so that the price will reverse quite soon and go in the opposite direction. In certain cases, such formations may provoke a full-scale reversal of the trend.

As a rule, such things happen at the moment of testing the support/resistance levels. This situation is similar to a reversal. However, it might be a test of a normal trendline, as well as the completion of such patterns of tech analysis as the Triangle or Head and Shoulders, when the price escapes the pattern and the falseness of such a breakout becomes questionable.

This type of breakouts pertains to chart analysis. If we are evaluating the chart without indicators, our evaluation will always be subjective to some extent. It is should be kept in mind that this is an integral part of chart analysis.

What is a false breakout?

In most cases, a false breakout is the "tail" of a Japanese candlestick, which means that the price tried to break the support level away but the sellers were not strong enough to secure themselves under this level. Then the price bounces and moves upwards. This might signify the strength of the buyers and forecast further growth.

Types of false breakouts

Larry Williams was one of the first experts to describe false breakouts. He singled out such a type as Specialists Trap. If the market is bullish, the pattern is formed at the breakout of the resistance level closing much higher than the resistance area. The minimum of the candlestick preceding the one with the breakout acts as a sort of a critical level here.

1-usdcad-false-breakdown.png


In the case of falling and breaking this level away, we should expect a market reversal and overall falling. Larry Williams thinks that here we can see the false breakout form when traders enter the market emotionally.

How to detect a false breakout?

Tech analysts give different hints on false breakouts of levels or trendlines. For example, a true breakout requires closing above the resistance level. If the close prices return under the level the breakout may be false, so no growth us to be expected here.

Also, there is a rule of 3% applicable to important levels and lines. It says that the prices must rise above the level by more than 3%.

Imagine we are watching good growth of the gold prices. The important support area is at the level of 1455. If this level is broken away we might speak about a potential reversal to a downtrend.

If we apply the rule of 3% here the price must fall below 1411 for the breakout to be true. A decline to 1450 and a return indicates a false breakout, after which the growth is likely to continue.

6-xauusd-breakdown.png


However, this rule is just an instrument that helps distinguish between true and false breakouts. Other traders add time filters or follow-up tests of the broken levels to avoid false breakouts.

How to use false breakouts?

Larry Williams points at the fact that it is impossible to know beforehand whether the level will be broken out or not. What is more, he insists on using our own methods of analysis to use false breakouts effectively. As we may see, when the market is growing and a reversal Double Top may form, it is likely that the breakout of the resistance level will be followed by a further decline of the price. So, if it looks like the pattern will form, no growth should be expected.

Conversely, if the market is falling and its structure reminds of a Double Bottom, one should not hurry to sell after a breakout. If the prices have managed to return inside the pattern soon after the breakout, a market reversal is likely to happen, so that the pattern will be executed.

Very often traders use the MACD indicator that shows divergences on the chart well. If at the moment of a breakout of an important level there forms a convergence or a divergence on the chart, the breakout is likely to be false and the market should be entered in the opposite direction.

Read more at R Blog - RoboForex

Sincerely,
RoboForex team
 
Dear traders!

This week, a RoboForex project called ContestFX will continue with the following exciting competitions:

The 145th competition of "Demo Forex" and the 407th competition of "Week with CFD" have just started.
The 541st competition of "Trade Day" will start on 05.04.2023 at 12:00.
The 455th competition of "KingSize MT5" will start on 06.04.2023 at 20:00.

It does not take much effort to participate in our contests: all you need to do is to register an account, and then any of the competitions you like will be available to you in just a couple of mouse clicks.

We're looking forward to your joining in and wish you good luck!

Sincerely,
RoboForex Contest
 
How To Trade the “S&P 500 Trend Following Strategy”

Author : Victor Gryazin

31.03.2023-1536x864.jpg


Dear Clients and Partners,

In this article, we will look at the long-term indicator trading "S&P 500 Trend Following" strategy. We will find out how it works, how it is used in trading, and what indicator signals it is based on. We will also list its advantages and disadvantages.

How the S&P 500 Trend Following strategy works

This long-term strategy implies trading the S&P 500 (US 500) stock index in the direction of the current market trend. Note that this index is probably the best-known and most popular stock index in the world. It includes the stocks of the 500 largest companies traded on the US stock market and serves as a barometer of the state of the US stock market.

Renowned investors and asset managers Meb Faber and Paul Tudor Jones are the creators and popularisers of the S&P 500 Trend Following strategy. They presented a rather simple and at the same time effective trend-following trading system for the S&P 500 Index, which is based on the signals of the 200-day moving average.

The S&P 500 often shows a steady uptrend during periods of a rising stock market. The indicator should help to identify the beginning of the next long-term trend and give investors a signal to buy to profit from the index growth.

To describe the strategy simply: when the S&P 500 is above the 200-day moving average, the trend is upward, and it is a good time to buy the index; when it is below the indicator line, the trend changes, moving downward, and all positions must be closed.

How to install the Moving Average indicator
The Moving Average (MA) has long established itself as a simple and effective tool for trend analysis. The indicator is included in most modern trading terminals where it is displayed directly on the price chart.

To set the Moving Average in the popular MetaTrader 4 and MetaTrader 5 trading platforms, follow these steps:
  1. Open the terminal and log in to your account.
  2. Select the S&P 500 from the list of available financial instruments and add it to the chart.
  3. From the main menu, click on Insert, then on Indicators, then on Trend, and select Moving Average.
  4. Select the period 200, the line colour and width, and the MA: Simple, and click OK to apply the settings and close the indicator settings window.
As a result, a 200-day moving average will appear on the price chart, which will be used to identify the current trend and search for trading signals according to the strategy.

trendSP500-2-1-1536x824.png


How to use the strategy in trading

The S&P 500 trend-following strategy trades in one direction only – to buy the asset. Its trading principle is simple:
  • When the closing price of the index crosses the 200-day Moving Average from bottom to top, this indicates the beginning of an upward trend and gives a signal to buy
  • When the closing price of the index crosses the 200-day moving average from top to bottom, this signals the end of the uptrend and the need to close buy positions
Advantages and disadvantages of the strategy

Advantages:
  • The strategy works well during a sustained uptrend, allowing you to profit on strong and prolonged movements of the S&P 500 index
  • The potential profit can be many times greater than the potential loss
Read more at R Blog - RoboForex

Sincerely,
RoboForex team
 
RoboForex: upcoming changes to the trading schedule in view of the Easter holidays

roboforex-header.jpg


Dear Clients and Partners,

We are informing you that due to the Easter holidays in Europe and the US, there will be some changes to the trading schedule on Good Friday and Easter Monday.

This schedule is for informational purposes only and may be subject to further change.

MetaTrader 4 / MetaTrader 5 platforms

Schedule for trading on CFDs on the German index DE40Cash
  • 7 April 2023 – no trading
  • 10 April 2023 – no trading
  • 11 April 2023 – trading as usual
Schedule for trading on CFDs on the US indices (US30Cash, US500Cash, USTECHCash) and the Japanese index JP225Cash
  • 7 April 2023 – trading stops at 4:00 PM server time
  • 10 April 2023 – trading as usual
Schedule for trading on Metals (XAUUSD, XAGUSD) and CFDs on oil (Brent, WTI)
  • 7 April 2023 – no trading
  • 10 April 2023 – trading as usual
Schedule for trading on CFDs on US stocks
  • 7 April 2023 – no trading
  • 10 April 2023 – trading as usual
Schedule for trading on CFDs on US futures
  • 7 April 2023 – trading stops at 4:15 PM server time
  • 10 April 2023 – trading as usual
R StocksTrader platform

Schedule for trading on US Stocks, US ETFs, CFDs on US Stocks and ETFs
  • 7 April 2023 – no trading
  • 10 April 2023 – trading as usual
Schedule for trading on CFDs on US indices (US30, US500, NAS100)
  • 7 April 2023 – trading stops at 4:00 PM server time
  • 10 April 2023 – trading as usua
Schedule for trading on CFDs on the EU indices (GER40, UK100, FRA40, SPA35), the Australian index AUS200, and the Japanese index J225
  • 7 April 2023 – no trading
  • 10 April 2023 – no trading
  • 11 April 2023 – trading as usual
Schedule for trading on CFDs on EU Stocks
  • 7 April 2023 – no trading
  • 10 April 2023 – no trading
  • 11 April 2023 – trading as usual
Schedule for trading on CFDs on UK Stocks
  • 7 April 2023 – no trading
  • 10 April 2023 – no trading
  • 11 April 2023 – trading as usual
Schedule for trading on CFDs on US futures
  • 7 April 2023 – trading stops at 4:15 PM server time
  • 10 April 2023 – trading as usual
Schedule for trading on Metals (XAUUSD, XAGUSD) and CFDs on Crude Oil (BRENT.oil, WTI.oil)
  • 7 April 2023 – no trading
  • 10 April 2023 – trading as usual
cTrader platform

Schedule for trading on Metals (XAUUSD, XAGUSD)
  • 7 April 2023 – no trading
  • 10 April 2023 – trading as usual
Please take note of the above trading schedule changes when planning your trading activity.

* – This schedule is for informational purposes only and may be subject to further change.

Sincerely,
RoboForex team
 
Dear traders!

This week, the ContestFX project brings to your attention the following competitions:

The 145th competition of "Demo Forex" is gaining momentum.
The 408th competition of "Week with CFD" has just started.
The 542nd competition of "Trade Day" will start on 12.04.2023 at 12:00.
The 456th competition of "KingSize MT5" will start on 13.04.2023 at 20:00.

We'd like to remind you that winners of our contests receive prize funds to their real trading accounts, and they can use them to start trading in the Forex market instead of investing their own savings.

Good luck to all traders!

Sincerely,
RoboForex Contest
 
RoboForex has increased partner commission for Gold, Silver, Oil, and US indices

bg-img.jpg


Dear Clients and Partners,

The RoboForex Partner Programme has become even better! We increased the partner commission for trading Gold, Silver, Oil, and US indices. As a RoboForex Partner you can now earn at least two times more when your clients trade these popular instruments.

4259519ed14d014f6a93be97491e220e.png


Example of partner commission rate for Pro accounts:

d2b8946e0dcd0279f072eb47a9be3209.png


Calculate your increased commission

Join one of the best markets' Partner Programme
  • High commission
    Earn up to 70% of the broker’s revenue, and additionally up to 20% within the framework of the loyalty programme.

  • Special Affiliate accounts
    Get maximum payouts with the help of client accounts with increased spreads and commissions for a transaction.

  • Multilevel programmes
    Create your own partner network in one of two schemes: 2 levels "VIP" programme, or 5 levels "Expert".

  • Copy-trading
    Attract clients to the CopyFX copy-trading system and receive commission like a Partner. And if you're an experienced trader, you can get two types of commission: one from investors copying your strategies, and the Partner commission.
How to become a Partner
  1. Open a Partner account
  2. Use promotional materials to attract clients
  3. Receive your commission for your referrals' transactions

Sincerely,
RoboForex team
 
Dear traders!

This week, a RoboForex project called ContestFX will continue with the following competitions:

The 145th competition of "Demo Forex" has been running since the beginning of the month.
The 409th competition of "Week with CFD" has just started.
The 543rd competition of "Trade Day" will start on 19.04.2023 at 12:00.
The 457th competition of "KingSize MT5" will start on 20.04.2023 at 20:00.

It does not take much effort to participate in our contests: all you need to do is to go through a simple registration procedure, and then any of the competitions you like will be available to you in just a couple of mouse clicks.

Good luck to all traders!

Sincerely,
RoboForex Contest
 
Last edited:
Situational Vs. Systematic Trading: Which One is More Efficient?

Author : Andrey Goilov

systematic-sitiational-trading.png


Dear Clients and Partners,

To be successful on financial markets, you need a neat trading system that will give you a clear understanding of how to enter and exit the market either with a profit or a loss. The rules of money management are also worth sticking to as they will psychologically prepare you for a series of losing trades as well as profitable ones.

Trading with a high-quality system is different from trading without one is also better in the sense that you do not need to think about whether the situation on the market is good enough to enter. You simply follow the rules and open or close trades, moving along the price chart.

Unfortunately, no one can tell if the current pattern will be executed or you will have to close it at the Stop Loss. To find out, you just have to trade the chosen method. Of course, you can use certain lifehacks and take measures to increase the probability of the execution of the signal, such as trading on a demo account until you receive two losing positions and only then moving to a real one. There are plenty of ways and methods of trading in the world, and every day millions of traders try to conquer the market.

In this article, we shall have a look at the pros and cons of both systematic and situational trading, discuss their differences, and speak about the practicability of each of them.

Systematic trading

Here, we are talking about a simple indicator-based system that will give the same signals to a dozen of different traders. As a rule, systematic trading does not allow for more than one opinion about the current market situation; the trader just needs to open a position and wait or to wait for a signal to enter the market.

In one of our posts, we spoke about the Ichimoku indicator. At first glance, it seems too complicated, but it boils down to trading the trend and waiting for the entrance signal to form. After that, we open a position and wait for the signals to form. For example, if the price breaks through the Ichimoku Cloud bottom-up, then you can buy.

ichimoku-flat-trend.png


If the price breaks through the Cloud top-down, the trend is likely to be descending, so you can sell. You do not need much time to make a decision, following the rules is enough.

Sure, in the times of a flat, you will be getting the breakaways all the time and either be opening and closing too many positions bringing no profit or suffering a series of insignificant losses. However, as soon as a trend begins, the market will be bringing the prices farther and farther from the entrance point. In such a case, you simply need to move the SL and hold the profit until the market reverses and closes your position.

Pros of trading along with the rules

It can often be heard that a good system is no more than 20% of success on the market while the remaining 80% is the ability to follow the rules of money management and stick to your own rules in the hard times, which will happen periodically.

As Victor Niederhoffer used to say: "In investments, as well as in life, the question is not whether you will be knocked down but when it will happen and whether you will manage to get up and keep fighting. The risk of failure is an essential part of human experience which is especially visible on financial markets dominated by speculation, which is the readiness to accept commercial risks".

A huge advantage of such an approach is the easiness of market analysis and decision-making. The lines have crossed — we sell, the lines have crossed back — we close the position and open a new one. If we hand the method to other traders, they will see the same crossings and will sell the same way due to the signal lines crossing. What is more, the trader feels less emotional pressure as he leaves decision-making to the system.

Pros and cons of situational trading

It must be admitted that an experienced trader can show a better result in trading graphic patterns than someone who has just seen a pattern and is trying to use it. In other words, experience is critical here. If you practice situational trading, you will have to think a lot and sometimes make hard decisions, which is lacking in the systematic approach to trading on financial markets.

So, analyzing charts regularly on different timeframes and sticking to your own rules of trading, sometimes postponing open positions due to low volatility, may be very hard in the long run. What should the trader choose?

How to choose an approach for a trader?

If the trader is new to the market, systematic trading by strict rules might be the best option. It will spare them from excessive market entries without good signals as well as decrease emotional pressure during a series of losing positions. In the process of trading, the beginner will be moving along the stages of a trader's development to the top where they can use their experience for situational trading, getting rid of some strict signals of the system that has shown the worst results.

We should not forget that a good system is just 20% of the overall result: you have to master risk control and feel confident suffering losses and locking in profit. A sports car will not make a racer out of an ordinary driver; same way, for situational trading you need experience and knowledge.

Read more at R Blog - RoboForex

Sincerely,
RoboForex team
 
What is Price Action Analysis?

Author : Timofey Zuev

9.jpg


Dear Clients and Partners,

Today we will talk about price action analysis, an important aspect of technical analysis on Forex. Price Action analyzes price behavior and patterns and can identify almost any market trend.

What is the subject of Price Action analysis, and how does it differ from graphic or indicator analysis?

The graphic analysis is meant to detect certain patterns on the chart that often reflect the interaction of demand and supply (buyers and sellers). For example, a Triangle, often emerging in the way of the trend, is normally a trend continuation pattern. In essence, a trader practicing graphic analysis need only to know this fact (that the Triangle is a trend continuation pattern) to make a decision. This simplifies analysis but creates additional limitations.

If the trader wants to figure out the reasons for the price movement, such an explication will not suffice – they need a more intricate understanding of market mechanisms. This need leads many traders to Price Action analysis.

Some say that Price Action analysis is just the analysis of simple candlestick patterns. Say, Rail or Pin Bar signal about an upcoming reversal, a breakaway of the inner bar signals to buy, etc.

In reality, such a simplistic approach to Price Action analysis will hardly be efficient: if you are eager to understand market processes from scratch, your analysis must become more complicated, not simpler. The number of details and factors that you must pay attention to will increase in a non-linear manner, and making decisions will become harder because the number of conflicting parts of the picture will grow (more signals and scenarios will appear for both buys and sales).

Of course, a trader does not need to see and understand everything: in the end, every market player chooses two or three trading styles and focuses on several types of events, such as breakaways of ranges or the appearance of trends two-three weeks long, etc. However, the understanding of Price Action frees the trader from a fixation on certain patterns – they start to operate principles and become able to find trading opportunities in virtually any market.

On the one hand, information becomes so plentiful that it needs filtration and specialization in a limited number of market situations; on the other hand, the abundance of information lets the trader see more in the market that forms no known-by-all pattern and gives no direct answers.

What does Price Action analysis consist of?

Understanding of patterns

A pattern is a figure on the chart that indicates some market process with a higher or lower probability. For example, if on the chart we see a candlestick with a large body and several other candlesticks that the first one incorporates, we may presume that the market is consolidating, and the following few hours, at least, the price will remain within the range. Why is this information helpful? For example, if we have decided to buy along with the trend, we should wait until the consolidation is over, or the price escapes the range. Similarly, we may see a 1-2-3 pattern that often indicates a beginning reversal.

However, just knowing the patterns is not enough: this alone will not give you any statistical advantage because the predictability of any financial market is quite low, no higher than 60% but normally lower. Forecasts seldom correlate with real events. Any forecast must be confirmed by price dynamics.

Watching price dynamics

This point is named like this for a reason: on history, charts look smooth and appealing, but in real-time, the market moves smoothly from point A to point B extremely rarely, if ever. Much more often, the market leaps abruptly in this or that direction, causing imbalance to traders. How could we use this information?

In fact, it is price dynamics that may indirectly indicate certain market processes. For example, increased aggressiveness and speed of market movements will most likely mean a lack of directed demand and supply (when the asset is accumulated for subsequent medium- and long-term positions) followed by a lack of a trend. A combination of sloppy price dynamics in consolidations with bolt-like breakaways in the direction of the trend will, on the contrary, most often indicate trend scenarios.

A bright example

Imagine an auction selling antiques. An auction house (best auction houses are usually English) puts something on sale for 1000 pounds but it turns out that no one wants to buy the thing for such a price. The auctioneer decreases it: 950 pounds, 900, 850, 800. AT last, a gentleman on the right is ready to buy. The auctioneer starts counting but an elderly lady offers 850 pounds. More and more participants get involved in the process, and the price soon overcomes 1000 pounds, where trading started, What has happened? Does the price not seem high anymore, or did auction players suddenly realize the value of the lot? In reality, the participants got involved in mass action, scared by rivalry or a probability to miss something important – anyways, the auction process has little in common with the real evaluation of a thing.

Read more at R Blog - RoboForex

Sincerely,
RoboForex team
 
Dear traders!

This week, the ContestFX project, as usual, is waiting for everyone to participate in the following competitions:

The 145th competition of "Demo Forex" has almost reached its final.
The 410th competition of "Week with CFD" has just kicked off.
The 544th competition of "Trade Day" will start on 26.04.2023 at 12:00.
The 458th competition of "KingSize MT5" will start on 27.04.2023 at 20:00.

All winners of our contests receive prize funds on their real trading accounts, and this money can be used for trading in Forex instead of investing the traders' own savings.

Don't miss your chance to be one of the winners!

Sincerely,
RoboForex Contest
 
How to Trade the Kicker Candlestick Pattern

Author : Victor Gryazin

21.04.2023-1536x864.jpg


Dear Clients and Partners,

In this review, we will get acquainted with a rather rare reversal candlestick pattern called Kicker. We will consider the features of its formation and the rules of trading with it.

How a Kicker candlestick pattern is formed

The Kicker candlestick pattern is not often seen on price charts and portends a reversal of the current trend, showing a sudden change in market sentiment. It is usually caused by important or unexpected news related to an asset.

A pattern consists of two candles of different colours: if the first is white, the second is black, and vice versa. The size of the body of the candles does not particularly matter. The body of the first candle follows the direction of the current trend, and the second candle opens with a gap from the opening price of the first candle and closes in the opposite direction.

The peculiarity of this pattern is that the second candle opens immediately with a large gap against the direction of the trend. If the first candle of the pattern is "bearish", the gap widens, and a white candle appears; if the first candle is "bullish", the gap shrinks, and a black candle follows. The gap covers the whole body of the first candle and forms a gap with its opening price.

A bullish Kicker candlestick pattern

This forms on the price chart during a downtrend when there is an active downward price movement and local lows are formed. First, the first black candle of the pattern appears, then the second candle opens with a large gap upwards and closes in white, showing growth. The "bears" were moving the market down, confident in their strength, but unexpected positive news strongly influenced market participants, and the situation changed dramatically. Now, the "bulls" have taken the initiative.

Thus, a bullish candlestick pattern Kicker has been formed on the chart. It is fully formed after the closing of the second candle with a white body, and it is assumed that the bulls, having received unexpected support and going on the offensive, will continue to move the price upwards. Thus, we can expect a severe upward correction or even a reversal and the start of a bullish trend.

Kicker-1.png


Bearish candlestick pattern Kicker

This forms on the price chart during an uptrend, which is when there is a strong upward price movement and local highs are formed. First, the first white candle of the pattern appears, then the second candle opens with a large downward gap and closes in black, showing a decline. "The bulls" had been driving the market upwards with a strong initiative, but unexpected negative news strongly influenced the market participants, and the situation changed dramatically: now the bears have taken the initiative.

So, a bearish Kicker candlestick pattern has been formed on the chart. It is fully formed after the second candle closes with a black body, and it is expected that the "bears", having received unexpected support and going on the offensive, will continue to move the quotes downwards. Thus, we can expect a severe downtrend or even a reversal and the start of a bearish trend.

How to buy on a bullish Kicker pattern
  • During a downtrend, a bullish Kicker pattern forms on the price chart.
  • It is recommended to open a buy position at the opening of the next candle after forming the pattern. Stop Loss can be set at the low of the first black candle.
  • The Fibonacci retracement lines and significant resistance levels can be used to set Take Profit.
Read more at R Blog - RoboForex

Sincerely,
RoboForex team
 
How Should a Beginner Prepare a Trading Plan?

Author : Victor Gryazin

4.jpg


Dear Clients and Partners,

In this overview, we will discuss preparing trading plans. A trading plan helps evaluate the current market situation and make the trader’s plans come to life.

What is a trading plan necessary for?

A trading plan is something like a road map for traders. Based on the trading strategy that you use, a trading plan formulates existing trading opportunities and promising trades. Promising trades are those that have a high probability of a success; they are made in the right place, at the right time, with a moderate risk and a good potential profit.

A trading plan must describe your trading ideas, your analysis of the current situation in detail. It makes a “picture” of your view on the market on paper (or in a file). On the whole, successful analysis and a correct opinion about the market do not guarantee good trading by themselves, however, your current thoughts can show you the field where you can look for trading ideas.

Having a clear and easy-to-understand trading plan, a trader stops making chaotic emotional trades. They are no more a helpless wood chip on market waves. They set their sails and starts off towards their profit, finding and closing promising trades. Thanks to the plan their trading becomes more efficient.

Preparing the plan

The process of preparation can be split in several steps: technical picture, fundamental factors, additional signals (indicators), risk control, taking the profit. Active traders make trading plans every day in the morning, bringing it to life during the day with necessary corrections and amendments.

Step 1: Technical picture

To evaluate the technical picture in an instrument, we use good old tech analysis. Open the chart of your financial instrument, check several timeframes (starting with larger ones and going down to smaller ones), and mark all the important factors:
  • Trend direction, trend lines
  • Support and resistance levels
  • Tech analysis patterns
  • Additional signals: Fibonacci levels, candlestick combinations, Price Action patterns, various original methods.
After you have marked everything on the chart, find suitable entry points on it by your strategy. Choose signals based on which you will open your position: a breakaway of or a bounce off an important level, exiting a price range, a complete tech analysis pattern, etc. Mark all the entry points and confirming signals in your trading plan.

tradingplan-technical-1002x630.png


Step 2: Fundamental factors

The main thing that pushes quotations in the market forward is fundamental news, such as decision on interest rates, publications of macroeconomic indicators, speeches of politicians, etc. Such news provokes volatility and gives guidelines for quotations.

To find out which news will come out and when, use an economic calendar. Open it in the morning and mark important events of the day. After some serious data emerges, a signal to open a position by your trading plan might appear – this is the gist of trading news. Or, on the contrary, you will have to close a profitable position or minimize risks (by pulling the Stop Loss closer) before some data appears.

Step 3: Signals from indicators

These days, there are plenty of indicators that help traders carry out holistic market analysis. Trading indicators are mathematical functions based on price or volumes. They not only help to analyze the market but can also give additional trading signals. Some indicators are good for trends, some – for flats, some are universal.

As a rule, traders use indicators as a supplement to tech analysis. Indicators can give confirming signals for opening positions; show the direction of the trend; give indications for placing Stop Losses and Take Profits. Write down the indicators you use and the opening and closing signal they give in the trading plan.

Read more at R Blog - RoboForex

Sincerely,
RoboForex team
 
Dear traders!

In the first week of May, the ContestFX project offers you the following demo contests:

The 146th competition of "Demo Forex" and the 411th competition of "Week with CFD" have just started.
The 545th competition of "Trade Day" will start on 03.05.2023 at 12:00.
The 459th competition of "KingSize MT5" will start on 04.05.2023 at 20:00.

If you have never taken part in our contests, all you have to do is to go through a simple registration procedure on our website and get access to any competitions in just a couple of mouse clicks.

Join us, it won't be boring!

Sincerely,
RoboForex Contest
 
How to Trade the “Two Moving Averages + Fractals” Strategy

Author : Victor Gryazin

28.04.2023-1536x864.jpg


Dear Clients and Partners,

In this overview, we will describe the simple medium-term swing trading strategy “Two Moving Averages + Fractals”. We will explain how it works, how to set the indicators, and how it can be used in trading.

What is swing trading?

Swing trading is a medium-term trading style that implies working with various financial instruments over the course of a few hours to a few weeks. As a rule, swing traders open trades in the direction of the current trend to catch the price movement momentum after the end of a local correction. In their search for trading opportunities, swing traders mainly use technical analysis.

How the “Two Moving Averages + Fractals” strategy works

The strategy uses two moving averages (Moving Average, MA) – the EMA (10) and SMA (30) – to confirm the trading direction and search for trading signals. The MA indicator has long been considered a simple and effective tech analysis tool, which tracks trend movements well. To pinpoint entry and exit points on the price chart, the strategy also uses Bill Williams’ Fractals indicator.

How the strategy works:
  • To find buy signals, the trader needs a downward correction after an upward price impulse. The EMA (10) must be above the SMA (30), confirming the uptrend. During the correction, the price should fall to the SMA (30) and form an uptrend reversal with the formation of a lower fractal – this will be a signal to buy
  • To find sell signals, the trader needs to wait for an upward correction after a downward price impulse. The EMA (10) must be below the SMA (30), confirming the downtrend. During the correction, the quotes must rise to the SMA (30) and form a downward reversal with the formation of an upper fractal – this will be a signal to sell
MAandFractals-1-1536x822.png

It should be noted that the Two MAs + Fractals strategy is particularly suitable for trading various financial instruments. The recommended timeframes on the chart are H1, H4, and D1. Trades are made in the direction of the trend at the end of the correction.

How to install the Moving Average and Fractals indicators

To install the indicators on the popular trading platforms MetaTrader 4 and MetaTrader 5, follow the process below:
  1. Open the terminal and log in to your account.
  2. Select the chart of your desired instrument.
  3. From the Main Menu, go to – Insert – Indicators – Trend, and then click on Moving Average.
  4. In the settings window that appears, select the period 10, the colour and width of the line, MA method – Exponential. Click OK to apply the parameters and close the settings window.
  5. Repeat the actions above but in the settings window select the period 30, the colour and width of the line, and the MA method – Simple. Click OK to apply the parameters and close the settings window.
  6. Go to the Main Menu – Insert – Indicators – Bill Williams, choose Fractals
  7. In the setting window that pops up choose the colour and size of the fractals; other parameters are set up automatically. Click OK to apply the parameters and close the setting window.
MAandFractals-2-1536x822.png

How to buy with the “Two MAs + Fractals” strategy
  • The market Is in an uptrend, and the EMA (10) is above the SMA (30)
  • During a downward correction, the quotes drop to the SMA (30) and form an upward reversal with the formation of a lower fractal
  • The trader opens a buy position and sets the Stop Loss just below the local low formed by the correction
  • The position is closed when the opposite upper fractal appears on the chart
Read more at R Blog - RoboForex

Sincerely,
RoboForex team
 
RoboForex provides access to CFDs on Futures

roboforex-header.jpg


Dear Clients and Partners,

We are happy to announce the latest expansion of our product line: in addition to the 12,000 instruments already available at RoboForex, you can now trade CFDs on Futures.

This is an excellent opportunity to trade this asset using higher leverage than on an exchange and benefit from the absence of swaps (rollover fees). CFDs on futures at RoboForex are available on MetaTrader 4/5 and R StocksTrader platforms.


Trade CFDs on futures at RoboForex on the following account types:

f8d71f735f708d3b4036c6b894557fa0.png


Start trading with RoboForex, and try out this and other trading assets with competitive conditions:
  • 12,000 trading instruments within nine asset classes
  • Floating spreads from zero points, and fast order execution
  • Minimum deposit from 10 USD
  • Leverage up to 1:2000

Sincerely,
RoboForex team
 
Top