How to Trade with Bulls Power and Bears Power Indicators?
Author: Victor Gryazin

Dear Clients and Partners,
This article is devoted to using two indicators: Bulls Power and Bears Power – in financial markets. These indicators are meant for measuring the strength of trends.
How do Bulls Power and Bears Power work?
These indicators were created by a famous trader and the author of the book “Elder Triple Screen” Alexander Elder. They help estimate the current power balance of buyers and sellers and catch the moment when bears/bulls are getting weaker. The combination of these indicators is also known as the Elder Ray.
Bulls Power demonstrates the strength of bulls in the market. It compares the highs with the Exponential Moving Average. If the Bulls Power histogram is above zero and growing, this means buyers are holding the price above the EMA, and bulls are now stronger than bears. And vice versa, if the histogram is declining, dropping below zero, this indicates the predominance of bears.
Bears Power, in its turn, demonstrates the strength of bears in the market. It compares the lows with the EMA. If the Bears Power histogram is below zero and declining, this means sellers are holding the price below the EMA, and bears are now stronger than bulls. However, if the histogram starts growing and rises above zero, this means bulls are in control of the market.
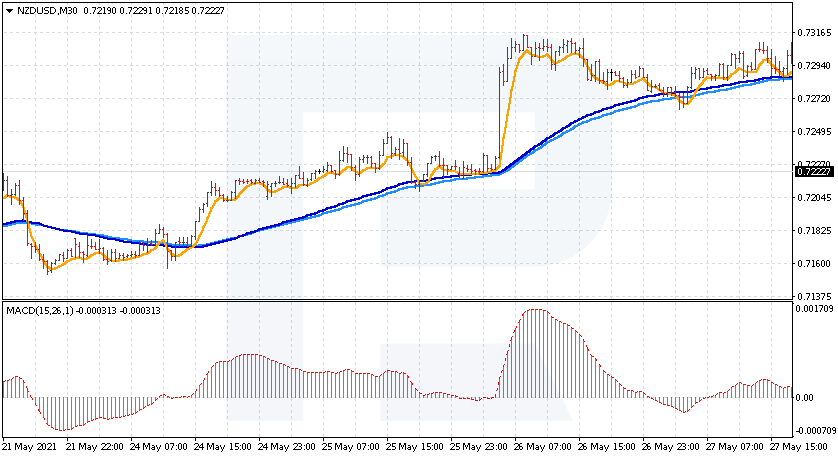
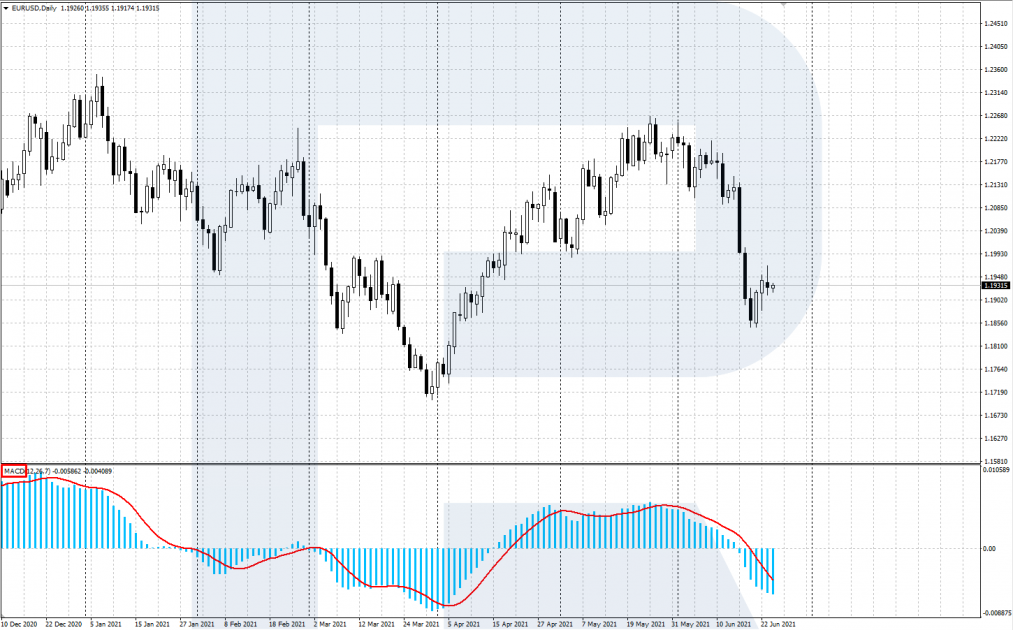
In essence, Bulls Power and Bears Power are irregular oscillators. They appear in separate windows under the price chart. They look like bar histograms with the central line at zero. To determine the direction of the active trend, Elder recommends adding to the chart an EMA (13), drawn by close prices.
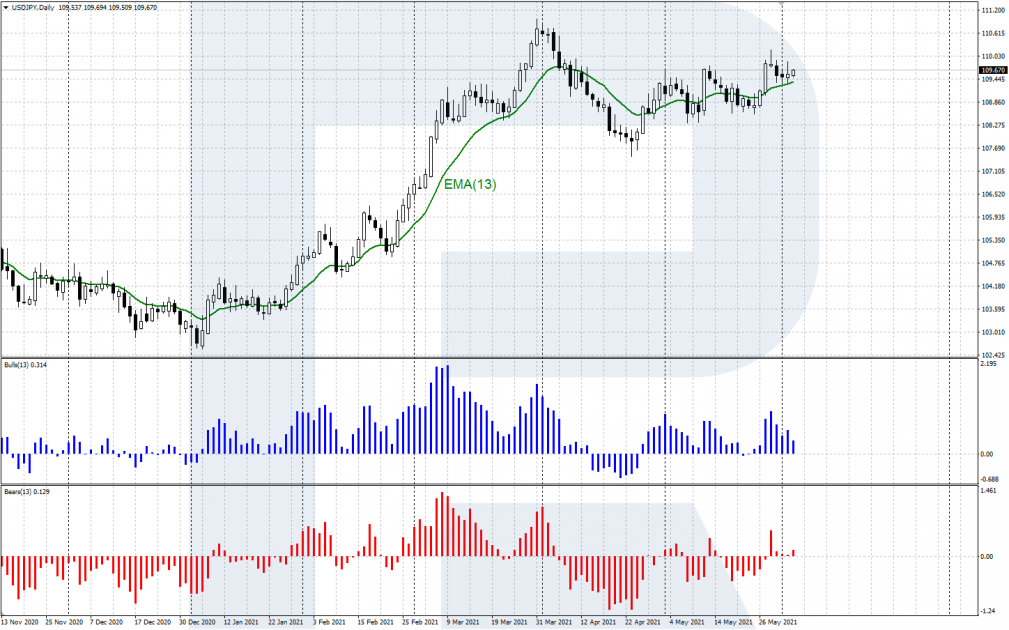
Installing and setting up the indicators
Bulls Power and Bears Power are included in many popular trading terminals. To install the indicator to the chart of your financial instrument in MetaTrader 4 or MetaTrader 5, go to the Main Menu: Insert/Indicators/Oscillators/Bulls Power and Bears Power.
The formulae of the indicators look as follows:
• Bulls Power = HIGH - EMA (13)
• Bears Power = LOW - EMA (13)
Read more at R Blog - RoboForex
Sincerely,
RoboForex team
Author: Victor Gryazin
Dear Clients and Partners,
This article is devoted to using two indicators: Bulls Power and Bears Power – in financial markets. These indicators are meant for measuring the strength of trends.
How do Bulls Power and Bears Power work?
These indicators were created by a famous trader and the author of the book “Elder Triple Screen” Alexander Elder. They help estimate the current power balance of buyers and sellers and catch the moment when bears/bulls are getting weaker. The combination of these indicators is also known as the Elder Ray.
Bulls Power demonstrates the strength of bulls in the market. It compares the highs with the Exponential Moving Average. If the Bulls Power histogram is above zero and growing, this means buyers are holding the price above the EMA, and bulls are now stronger than bears. And vice versa, if the histogram is declining, dropping below zero, this indicates the predominance of bears.
Bears Power, in its turn, demonstrates the strength of bears in the market. It compares the lows with the EMA. If the Bears Power histogram is below zero and declining, this means sellers are holding the price below the EMA, and bears are now stronger than bulls. However, if the histogram starts growing and rises above zero, this means bulls are in control of the market.
In essence, Bulls Power and Bears Power are irregular oscillators. They appear in separate windows under the price chart. They look like bar histograms with the central line at zero. To determine the direction of the active trend, Elder recommends adding to the chart an EMA (13), drawn by close prices.
Installing and setting up the indicators
Bulls Power and Bears Power are included in many popular trading terminals. To install the indicator to the chart of your financial instrument in MetaTrader 4 or MetaTrader 5, go to the Main Menu: Insert/Indicators/Oscillators/Bulls Power and Bears Power.
The formulae of the indicators look as follows:
• Bulls Power = HIGH - EMA (13)
• Bears Power = LOW - EMA (13)
Read more at R Blog - RoboForex
Sincerely,
RoboForex team