Julia NordFX
Broker Representative
Forex Forecast for EURUSD, GBPUSD, USDJPY and USDCHF for 26 - 30 June 2017
First, a review of last week’s forecast: the holiday season is approaching, which may be the cause of the diminishing stream of significant economic events. This necessarily affects the volatility of the major currency pairs, which have come close to the targets indicated by analysts, without having successfully overcome them.
- Thus, last week, the maximum range of the EUR/USD fluctuations hardly exceeded 90 points. Recall that 75% of our experts had assumed that the pair should descend to the support at 1.1100. Allowing for the standard backlash, that was what happened: the week's low was fixed at 1.1118. However, the bears' strength then dried up, and the bulls returned the pair to the same place from where it had started the five-day period;
- Regarding the GBP/USD, recall that 70% of analysts had voted for the fall of the pair, whilst technical analysis had determined 1.2580 as the local minimum. This forecast turned out to be correct, and by the middle of the week the pair had actually fallen to 1.2587. Then, just as in the case of EUR/USD, the trend reversed and the pair retreated north, returning to Pivot Point of the last two weeks in the 1.2715 zone;
- The USD/JPY. The basic forecast, supported by 90% of experts, graphical analysis and 70% of indicators, had suggested that the pair would certainly try to break through the 112.00 resistance. This is what happened in reality: at the very beginning of the week’s session, the pair rushed upwards and, flying up 100 points, quickly reached 111.77. It then rolled back a bit, after which it tried to conquer the treasured height three times. However, after all these attempts were exhausted, the pair retreated downwards by 50 points and finished the week at 111.27;
- However, the forecasts for the future of USD/CHF have not been fulfilled. The pair’s uptrend was expected to continue, which would have carried it to at least the resistance of 0.9810. However, the pair stayed in the side channel of the last five weeks - 0.9620-0.9770 - and completed the week session near its central line in the 0.9695 zone.
***
As for the forecast for the coming week, summarizing the opinions of analysts from a number of banks and broker companies, as well as forecasts made on the basis of a variety of methods of technical and graphical analysis, we can say the following:
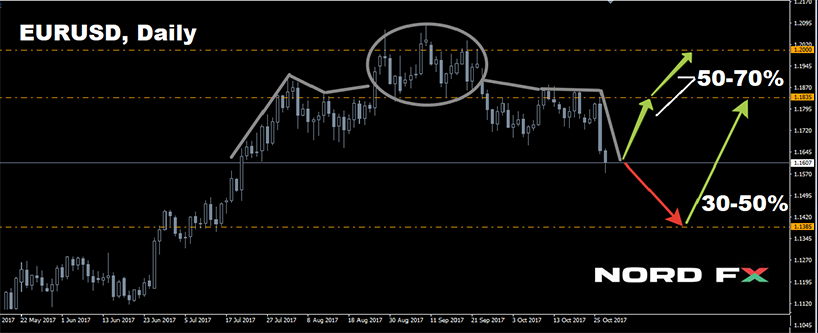
- EUR/USD. As for indicators, about 90% of them look to the north on H4. But with the transition to a larger D1 time frame, the forecast changes to neutral. Moreover, almost a quarter of the oscillators already show that this pair is overbought, thereby recommends to sell. The graphical analysis on D1 and about 70% of analysts also agree with this, pointing to a possible fall of the pair first to 1.1100, and then even lower to the 1.0850-1.0960 area.
Speaking about the very near future, on Monday 26 June, the release of positive data on the US consumer market is expected, which may help strengthen the dollar. However, it may take the pair anything from one to several weeks to achieve these goals.
An alternative point of view sees the growth of the pair first to the resistance of 1.1285, and in the event of a breakthrough, even higher, bringing it to the 1.1400 region. However, in the medium term this forecast is supported by less than 10% of experts;
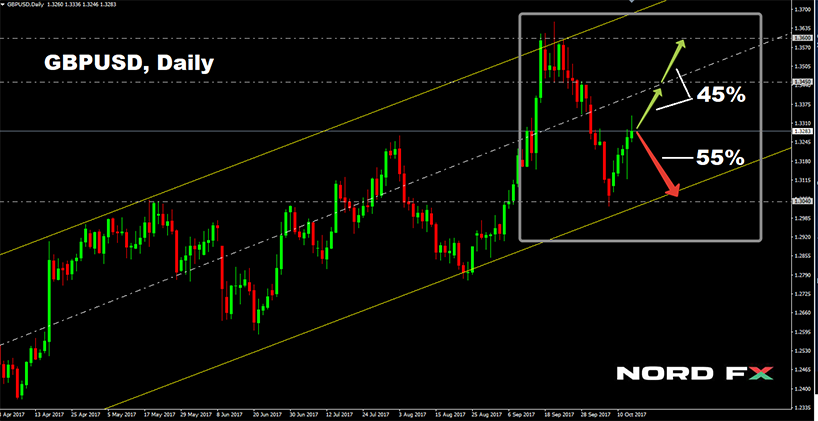
- As for the future of GBP/USD, here, too, most analysts are set to sell this pair. But a majority as obvious as the one for EUR/USD is nowhere to be seen: the vote is split 55% / 45%. Trend indicators and oscillators on D1 are on the side of the majority, whilst their "colleagues" on H4 as well as graphical analysis on both H4 and D1 side with the minority.
The nearest target for the bulls is 1.2815, the medium-term targets are 1.2920, 1.2975 and 1.3045. As for the bears, they will try to drop the pair first to the 1.2585-1.2630 region, before carrying it down by another ‘echelon’ to the 1.2365-1.2585 area;
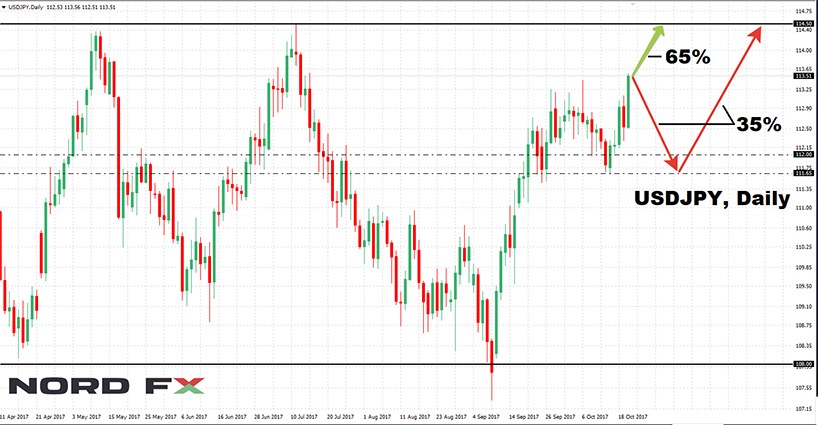
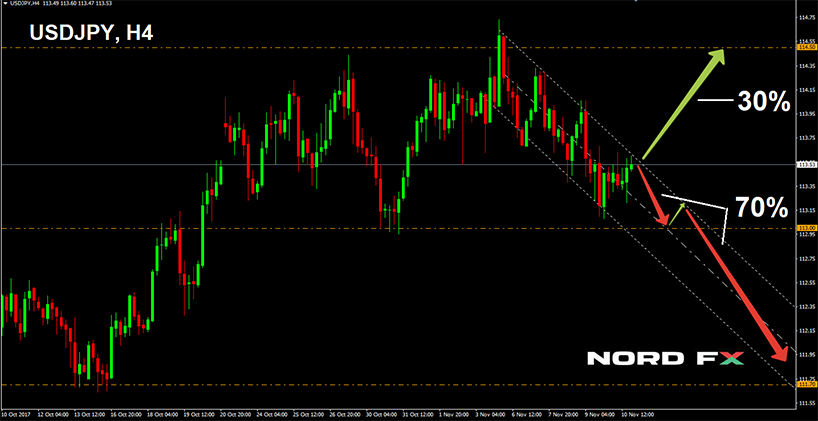
- USD/JPY. The indicators on H4 are much more confident here than on D1. The former believe that the pair will once again try to take the height of 112.00, and this attempt should be crowned with success. Graphic analysis and about 60% of experts agree with this development. At the same time, graphical analysis on D1 indicates that after the pair reaches 112.15, it may roll back to 109.65-110.00;
- and the last pair of our review is the USD/CHF. If last week almost all the indicators were painted green, now many of them have changed to red, insisting that the pair will necessarily test the local minimum of 0.9610 again.
70% of experts, graphical analysis and about half of oscillators on D1 strongly disagree with this forecast. Based on the fact that the pair is oversold, they continue to insist on it moving to the upper boundary of the medium-term downtrend channel at 0.9910, which started early in 2017. The nearest resistance is 0.9810.
Roman Butko, NordFX
Notice: These materials should not be deemed a recommendation for investment or guidance for working on financial markets: they are for informative purposes only. Trading on financial markets is risky and can lead to a loss of money deposited.
#forex #forex_forecast #eurusd #signals_forex #binary_options
https://www.nordfx.com/
First, a review of last week’s forecast: the holiday season is approaching, which may be the cause of the diminishing stream of significant economic events. This necessarily affects the volatility of the major currency pairs, which have come close to the targets indicated by analysts, without having successfully overcome them.
- Thus, last week, the maximum range of the EUR/USD fluctuations hardly exceeded 90 points. Recall that 75% of our experts had assumed that the pair should descend to the support at 1.1100. Allowing for the standard backlash, that was what happened: the week's low was fixed at 1.1118. However, the bears' strength then dried up, and the bulls returned the pair to the same place from where it had started the five-day period;
- Regarding the GBP/USD, recall that 70% of analysts had voted for the fall of the pair, whilst technical analysis had determined 1.2580 as the local minimum. This forecast turned out to be correct, and by the middle of the week the pair had actually fallen to 1.2587. Then, just as in the case of EUR/USD, the trend reversed and the pair retreated north, returning to Pivot Point of the last two weeks in the 1.2715 zone;
- The USD/JPY. The basic forecast, supported by 90% of experts, graphical analysis and 70% of indicators, had suggested that the pair would certainly try to break through the 112.00 resistance. This is what happened in reality: at the very beginning of the week’s session, the pair rushed upwards and, flying up 100 points, quickly reached 111.77. It then rolled back a bit, after which it tried to conquer the treasured height three times. However, after all these attempts were exhausted, the pair retreated downwards by 50 points and finished the week at 111.27;
- However, the forecasts for the future of USD/CHF have not been fulfilled. The pair’s uptrend was expected to continue, which would have carried it to at least the resistance of 0.9810. However, the pair stayed in the side channel of the last five weeks - 0.9620-0.9770 - and completed the week session near its central line in the 0.9695 zone.
***
As for the forecast for the coming week, summarizing the opinions of analysts from a number of banks and broker companies, as well as forecasts made on the basis of a variety of methods of technical and graphical analysis, we can say the following:
- EUR/USD. As for indicators, about 90% of them look to the north on H4. But with the transition to a larger D1 time frame, the forecast changes to neutral. Moreover, almost a quarter of the oscillators already show that this pair is overbought, thereby recommends to sell. The graphical analysis on D1 and about 70% of analysts also agree with this, pointing to a possible fall of the pair first to 1.1100, and then even lower to the 1.0850-1.0960 area.
Speaking about the very near future, on Monday 26 June, the release of positive data on the US consumer market is expected, which may help strengthen the dollar. However, it may take the pair anything from one to several weeks to achieve these goals.
An alternative point of view sees the growth of the pair first to the resistance of 1.1285, and in the event of a breakthrough, even higher, bringing it to the 1.1400 region. However, in the medium term this forecast is supported by less than 10% of experts;
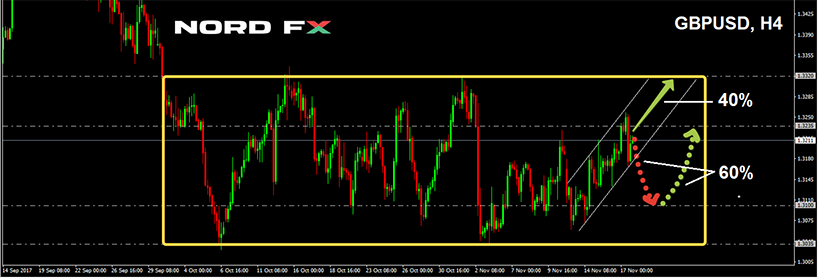
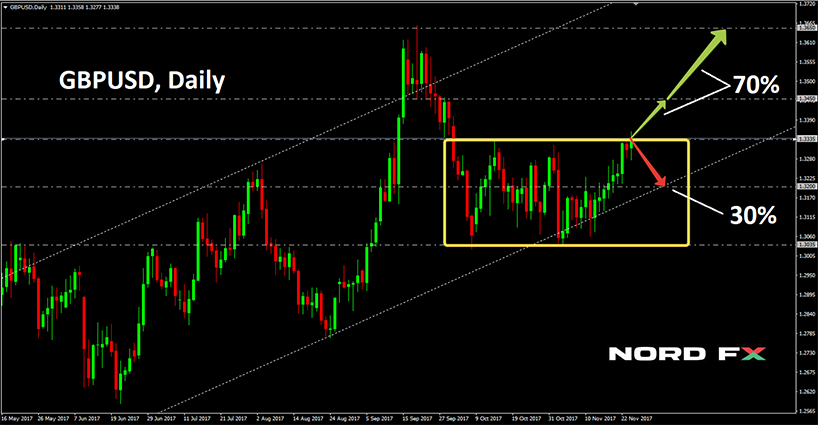
- As for the future of GBP/USD, here, too, most analysts are set to sell this pair. But a majority as obvious as the one for EUR/USD is nowhere to be seen: the vote is split 55% / 45%. Trend indicators and oscillators on D1 are on the side of the majority, whilst their "colleagues" on H4 as well as graphical analysis on both H4 and D1 side with the minority.
The nearest target for the bulls is 1.2815, the medium-term targets are 1.2920, 1.2975 and 1.3045. As for the bears, they will try to drop the pair first to the 1.2585-1.2630 region, before carrying it down by another ‘echelon’ to the 1.2365-1.2585 area;
- USD/JPY. The indicators on H4 are much more confident here than on D1. The former believe that the pair will once again try to take the height of 112.00, and this attempt should be crowned with success. Graphic analysis and about 60% of experts agree with this development. At the same time, graphical analysis on D1 indicates that after the pair reaches 112.15, it may roll back to 109.65-110.00;
- and the last pair of our review is the USD/CHF. If last week almost all the indicators were painted green, now many of them have changed to red, insisting that the pair will necessarily test the local minimum of 0.9610 again.
70% of experts, graphical analysis and about half of oscillators on D1 strongly disagree with this forecast. Based on the fact that the pair is oversold, they continue to insist on it moving to the upper boundary of the medium-term downtrend channel at 0.9910, which started early in 2017. The nearest resistance is 0.9810.
Roman Butko, NordFX
Notice: These materials should not be deemed a recommendation for investment or guidance for working on financial markets: they are for informative purposes only. Trading on financial markets is risky and can lead to a loss of money deposited.
#forex #forex_forecast #eurusd #signals_forex #binary_options
https://www.nordfx.com/