• The Forex, Binary Options Forum - welcomes you to our Community!

    DigitalCashPalace Forum is dedicated to discussions about Forex, Binary Options, commodities, stocks related.

    Please take a look around, and feel free to .

Market analysis and trade recommendations by FBS

AUD/USD Daily analytics
07:28 15.03.2018

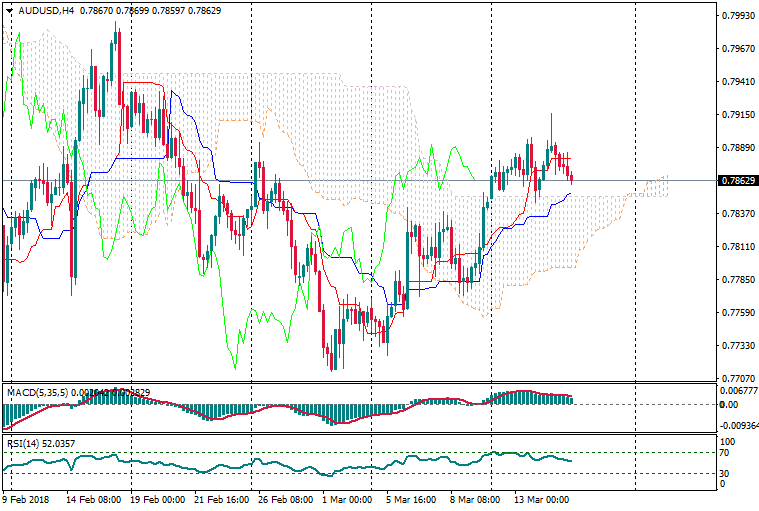
Technical levels: support – 0.7850; resistance – 0.7910, 0.7940

Trade recommendations:

Buy — 0.7850; SL — 0.7830; TP1 — 0.7910; TP2 — 0.7940.
Sell — 0.7830; SL — 0.7850; TP1 — 0.7780; TP2 — 0.7740.
Reason: expanding bearish Ichimoku Cloud with rising Senkou Span A; a golden cross of Tenkan-sen and Kijun-sen with rising Kijun-sen; the prices in a correction to the Cloud and the market needs Cloud’s support.

1521098890-42a68b4bfa2f0515dfbaa054e9dbae66_1200x1200_q90v3.png


More:
https://goo.gl/DxC5tJ
 
USD/JPY Daily Analytics
07:29 15.03.2018
Technical levels: support – 105.80; resistance – 106.25.

Trade recommendations:

Sell — 106.25; SL — 106.45; TP1 — 105.50; TP2 — 105.00.
Reason: bearish Ichimoku Cloud with falling Senkou Span A and B; a cancelled golden cross of Tenkan-sen and Kijun-sen with the falling lines; the prices entered into the negative area and may continue the downtrend.

1521098890-3dcc4d3b0e9d38341d309e86e7227f36_1200x1200_q90v3.png


More:
https://goo.gl/HrH9dE
 
EUR/JPY Daily Analytics
07:33 15.03.2018
Recommendation:

SELL 130.90

SL 131.45

TP1 129.65 TP2 128.95

On the daily chart of EUR/JPY, the “Shark” pattern is transforming into 5-0. A pullback from resistance at 132.2-132.5 (38.2% of the wave CD) allowed to form short positions. If bears manage to keep the pair below 131.25, the risks of the decline’s continuation will increase.

1521099107-8afba167b3e7c15d0d5d28d0f3c7b966_1200x1200_q90v3.png


On H1, the inability of bulls to push the pair above 132.00 points at their weakness. A break of support at 130.9-130.95 will create the ground for the decline to 88.6% and 113% targets of the “Shark”.

1521099139-144c086f9efd0dd7367f2818eb875c0e_1200x1200_q90v3.png


More:
https://goo.gl/W8hY5x
 
USD/JPY Daily Analytics
07:38 15.03.2018
Recommendation:

SELL 106.4

SL 106.95

TP1 105.4 TP2 105 TP3 102.8

On the daily chart of USD/JPY, bears managed to keep the pair inside the downtrend channel. The downtrend is sustainable. The pair keeps declining towards 161.8% target of AB=CD.

1521099470-3297c54597baddc0779dab87f73568a2_1200x1200_q90v3.png


On H1, USD/JPY reached the targets of “Three Indians”. If the pair reaches 88.6% of the “Shark” pattern will increase the risks of the decline towards 23.6%, 38.2% and 50% of the wave CD. The correction will allow forming short positions.

1521099484-1f50b4d918123f905c31c70a9dfda50a_1200x1200_q90v3.png


More:
https://goo.gl/Gy47rU
 
EUR/USD Daily Analytics
07:21 16.03.2018

Technical levels: support – 1.2290; resistance – 1.2360.

Trade recommendations:

Buy — 1.2380; SL — 1.2360; TP1 — 1.2480; TP2 — 1.2520
Sell — 1.2280; SL — 1.2300; TP1 — 1.2210; TP2 — 1.2130
Reason: narrow bearish Ichimoku Cloud with falling Senkou Span A and B; a new dead cross of Tenkan-sen and Kijun-sen with falling Tenkan-sen; the prices are fell down into the negative area.

1521184854-5974574d0f06c411e972e24d898d2405_1200x1200_q90v3.png


More:
https://goo.gl/2M8yR6
 
GBP/USD Daily analytics
07:22 16.03.2018

Technical levels: support – 1.3930; resistance – 1.4010.

Trade recommendations:

Buy — 1.3960; SL — 1.3930; TP1 — 1.4010; TP2 — 1.4070.
Sell — 1.3920; SL — 1.3940; TP1 — 1.3850; TP2 — 1.3760.
Reason: expanding bullish Ichimoku Cloud, but falling Senkou Span B(!); a golden cross of Tenkan-sen and Kijun-sen; the market supported by Cloud, but the Bulls can’t continue an existing uptrend.

1521184854-5838ef800660551113de2aff99712827_1200x1200_q90v3.png


More:
https://goo.gl/oUq8XD
 
EUR/USD Daily Analytics
08:59 16.03.2018
Recommendation:

SELL 1.2250

SL 1.2305

TP1 1.2150 TP2 1.2080 TP3 1.1960

On the daily chart, EUR/USD keeps forming a «Widening wedge”. The inability of bulls to hold to 1.2307-1.2320 will point at their weakness and open the way down towards 127.2% target of AB=CD.

1521190685-8afba167b3e7c15d0d5d28d0f3c7b966_1200x1200_q90v3.png


On H1, EUR/USD bears are ready to test the support at 1.2275. Success will allow them to trigger the “Crab” pattern with a target at 161.8%. Conservative approach means selling at 23.6% of the wave 4-5 of the widening wedge pattern.

1521190707-144c086f9efd0dd7367f2818eb875c0e_1200x1200_q90v3.png


More:
https://goo.gl/gBnsB9
 
EUR/GBP Daily Analytics
09:45 16.03.2018
Recommendation:

SELL 0.8820

SL 0.8875

TP1 0.8745 TP2 0.8715

On the daily chart, EUR/GBP keeps consolidating in line with the “Spike and ledge” pattern on the basis of 1-2-3. The attempt of the bulls to hold at 0.8925 targeting 161.8% of the junior AB=CD failed. As a result, bears seized the initiative.

1521193445-bc1ce4ebdd72b71af2881b8edc2b5fe5_1200x1200_q90v3.png


On H1, EUR/GBP reached the target of the “Widening wedge”. A break of support at 0.8820 will increase the risks of a “Shark” pattern with a target at 88.6%. The nearest resistance is near 0.8875.

1521193463-311438cdc50bb0f634d8ee27e47a0113_1200x1200_q90v3.png


More:
https://goo.gl/qHVk5i
 
EUR/USD Daily Analytics
12:56 16.03.2018

1521204874-78cf12d19fc10d2c7d2bb4a240fdb5ef_1200x1200_q90v3.png


The main trend is still bullish. The 89 Moving Average has acted as support, so there's a "V-Bottom" pattern. It's likely that the market is going to test the next resistance at 1.2346 - 1.2359 in the short term. If a pullback from these levels happens afterwards, there'll be a moment for a bearish correction.

1521204874-666e7131986c0f5ca3fb6780594b627d_1200x1200_q90v3.png


Bears faced with resistance at 1.2290, so there's a "Thorn" pattern. In this case, we should keep an eye on the Moving Averages as the nearest bullish target. A pullback from these lines could be a departure point for another decline.

More:
https://goo.gl/u3k3Zb
 
GBP/USD Daily Analytics
12:58 16.03.2018

1521204874-4ba2e257e3736ffa547d18ade2f28a0e_1200x1200_q90v3.png


There's a bullish "Flag" pattern, so the pair is likely going to reach the next resistance at 1.3996 - 1.4069. However, if we have a pullback from these levels, there'll be a moment for a downward price movement towards the nearest support at 1.3928.

1521204874-df16e1cc6dd449b27766e0cacf358cc9_1200x1200_q90v3.png


The price is consolidating above the Moving Averages. The main intraday target is the closest resistance at 1.3995 - 1.4023. If a pullback from this area happens little later on, bears will probably try to test the nearest support at 1.3928 - 1.3910.

More:
https://goo.gl/kTig5K
 
EUR/USD Daily Analytics
13:20 16.03.2018

1521205583-35c5d973e8e7296a8341db72d1488abc_1200x1200_q90v3.png


There's a "Morning Star" pattern, which has been confirmed. Therefore, the 21 Moving Average is likely going to at as resistance, which could be a starting point for another decline.

1521205583-b06a268a461599299bd9370bf2321f96_1200x1200_q90v3.png


The price has been declining since the last "Tweezers" pattern was formed. If the Moving Averages act as resistance, the market is likely going to test the lower "Window"

More:
https://goo.gl/MBiLUX
 
USD/JPY Daily analytics
13:22 16.03.2018

1521205583-33061b0cdc65a327af1853b683980e85_1200x1200_q90v3.png


The price is declining under the Moving Averages. The main intraday target is the lower "Window". If a pullback from this level happens, there'll be a moment for an upward correction.

1521205583-f009b520a1f905bcf7e6125da0471406_1200x1200_q90v3.png


The last "Shooting Star" pattern led to the current decline. However, if any reversal pattern forms, there'll be an opportunity to have a bullish correction towards the Moving Averages.

More:
https://goo.gl/djnNPd
 
TRADER VIC’S 2B PATTERNS. 2⃣

A failed breakout is probably one of the most annoying and unfortunately frequent phenomena in trader’s life. Traders invented various methods to deal with them. We will tell you about the easiest Trader Vic's 2B pattern In this article, so you can learn
the breakout pattern’s trading rules in case of down-/uptrends.

https://goo.gl/A9ouFx

y3JqzsL.jpg
 
Reliability? That's FBS Deposit Insurance!

https://goo.gl/3WUbb5
You like to play at the edge of the cliff to get highr Profit !
FBS makes it safer for you - Insure your funds RIGHT NOW and turn the risk into your favor.
Check it out here and use your trading skills to the maximum potential!⬇

b1Smwgw.jpg
 
DAX – stands for Deutscher Aktienindex, part of the German stock index is a blue chip stock market index consisting of the 30 major German companies trading on the Frankfurt Stock Exchange! And now you can get your profit trading DAX with FBS. Try it today! ⤵

Link: https://goo.gl/RHcisV

bD6xtAa.jpg
 
MOMENTUM FOREX STRATEGY ⏳


The momentum indicator is classified as an oscillator. It is designed to identify the strength of price movement; it helps traders to assess the extent of price fluctuations for a certain period as well as determine critical conditions that can be used for the position opening. In this article you will learn how to use it with a strategy as a trend trading system https://goo.gl/NGw4ez

2QSF8e5.png
 
It's Spring - The time of sweet dreams to come true!

https://goo.gl/LK5Dhh
Finally the most charming month of the year is here - March!
Here you are a unique opportunity in this gorgeous time of the year to make your sincere dream blossom through sharing it with FBS family.

Dream BIG now

fJh9xIZ.jpg
 
Best Trading Books

Trading Psychology 2.0 is a book containing lots of proven techniques and critical recommendations to help interested traders better understand the markets and themselves. It was written by the veteran trading psychologist – Brett Steenbarger.

Trading psychology 2.0 is grounded in the ABCD themes, the key components that might set your mind on success. In four chapters Steenbarger tackles adapting to change, building on strengths, cultivation of creativity, and developing and integrating best practices. These techniques differs markedly from “old school” ones.

For the 2.0 school of psychologists, the ideal trader is a creative entrepreneur, easily adjusting his trading strategy to new circumstances. The main goal of 2.0 trade is to discover his talents, skills, interests, master his trading techniques and properly exploit them in ever-shifting market dynamics.

Read this book and trade successfully Forex with FBS https://goo.gl/oPivFE

LwRRHZC.jpg
 
Did you know? You can deposit in Bitcoin with FBS !

Try it NOW ➡ https://goo.gl/ASnN7Z

FBS continues to expand payment options to meet your needs and make the trading experience more easy for you.
Yes, you can deposit your account in Bitcoin with 0 commission!
If you have a BTC wallet, feel free to select the Bitcoin by Skrill option next time you want to deposit funds, and enjoy instant transactions to make more money!

jvvxrj4.jpg
 
FBS Football FINALE! https://goo.gl/Y6hxtn
The contest was an absolute hit! Check out the winners!
Let us know what you thought about the contest on our social networks - who knows, maybe people who missed the first round will get a SECOND CHANCE!

cHLORTZ.jpg
 
Top