• The Forex, Binary Options Forum - welcomes you to our Community!

    DigitalCashPalace Forum is dedicated to discussions about Forex, Binary Options, commodities, stocks related.

    Please take a look around, and feel free to .

Market analysis and trade recommendations by FBS

USD/CHF Daily Analytics
06:58 31.01.2018
Recommendation:

SELL 0.9310 SL 0.9365 TP1 0.9210 TP2 0.9110 TP3 0.9030

BUY 0.9395 SL 0.9340 TP 0.9465 TP2 0.9500 TP3 0.9600

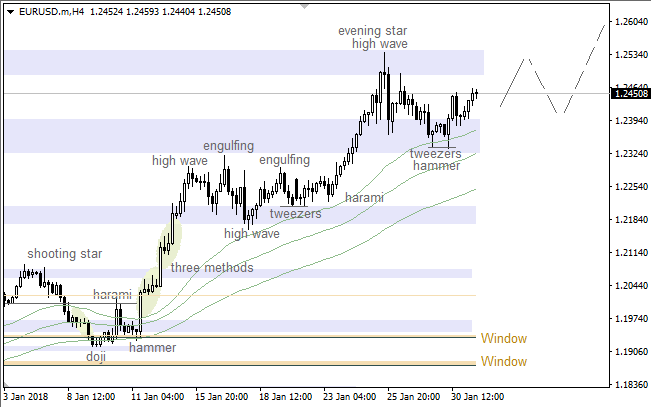
On the daily chart, USD/CHF formed a short-term consolidation. A decline below January low will allow the pair to continue the decline towards 161.8% target of the “Crab” pattern. The nearest resistance levels are near 0.9410 and 0.9485.

1517381840-a5903a7f3cf43bc4f33886526fd841ba_1200x1200_q90v3.png


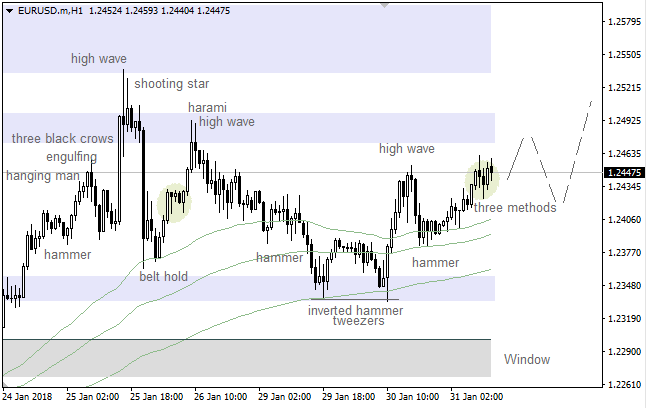
On H1, there’s a “Spike and ledge” pattern. A break of the lower border of the 0.9310-0.9395 consolidation range will open the way down for bears. On the other hand, successful test of resistance at 0.9395 will increase the odds of a pullback.

1517381860-351a015a31e5fdb2fee97b43bc66aebc_1200x1200_q90v3.png


More:
https://fbs.com/analytics/articles/...ampaign=EN_English&utm_content=Riki_Analytics
 
GBP/USD Daily Analytics
07:05 31.01.2018
Recommendation:

BUY 1.4285

SL 1.423

TP1 1.4385 TP2 1.461 TP3 1.4715

On the daily chart, GBP/USD pulled back after reaching 200% target of the AB=CD pattern. Advance beyond January high will allow the pound to continue rising towards $1,4610. As long as the pair’s trading above $1,405, bulls remain in control.

1517382252-b6b56ed02b1869ac79ae2067aff9ca74_1200x1200_q90v3.png


On H1, GBP/USD keeps forming “Spike and reversal with acceleration”. The inability of bears to return the pair inside the uptrend points at their weakness.

1517382268-351a015a31e5fdb2fee97b43bc66aebc_1200x1200_q90v3.png


More:
https://fbs.com/analytics/articles/...ampaign=EN_English&utm_content=Riki_Analytics
 
WILL DOVISH YELLEN BECOME HAWKISH?
11:51 31.01.2018

Janet Yellen leaves the post of the Fed chair this Friday, February 2. The policy of Yellen was known more as dovish, she used to be cautious and did not hurry to tighten policy more than necessary. However, now experts expect a hawkish-sounding speech from her.

The final meeting of Yellen as a chair of the Fed has started yesterday and ends today on Wednesday, January 31.

Janet Yellen has spent 4 years as the chair of the Federal Reserve. She began the slow process of normalizing interest rates after her predecessor led interest rates to zero during the financial crisis in 2008. Yellen also started reducing the Fed’s $4 trillion balance sheet. Her policy is highly appreciated (although apparently not by Donald Trump).

1517399442-e58ed12974e2759bb0e3e1218ef6fddf_1200x1200_q90v3.jpg


So what will she say in her last speech?

During this meeting, Donald Trump’s recent tax cuts will be discussed. It is possible that Yellen will announce a positive effect of tax cuts. This conclusion is based on holiday consumer spending and business investment. So it could mean that interest rates will rise more likely sooner than later. But at the same time, it will depend on the new Chairman Mr. Powell, who is supposed to continue the policy of Yellen, however, we may see some deviations.

Also, experts are waiting for bullish commentary regarding the economy in general. For example, J.P. Morgan economists expect that the Fed will describe the economy in a positive way adding that “easy financial conditions” support the growth.

Such indicators as higher commodities prices and progress in manufacturing and services sector will support the hawkish mood of the Yellen’s speech.

Although inflation is below target, it has firmed and core inflation rebound will be taken as the main indicator of a positive forecast.

However, experts do not expect any increase in interest rates now, but they suppose that positive comments about the US economy will give a sign of an interest rates rise in March.

Despite the anticipated hawkish-sounding speech, the US dollar decreased against most other major currencies. But other events, such as Trump’s unclear address, should be taken into account as well.

Making a conclusion, we can say that in spite of the fact that Yellen’s policy was evaluated mostly as dovish her last speech as the chair of the Fed is supposed to be hawkish because of the good indicators of the economic growth and first results of tax cuts. The Fed will not make any statements about the interest rate, however, the address of Yellen will give clues of its soon rise.

More:
https://fbs.com/analytics/articles/...ampaign=EN_English&utm_content=Riki_Analytics
 
EUR/USD Daily Analytics
11:53 31.01.2018

1517399526-45e3e1d322717d8b3ecdc21340560156_1200x1200_q90v3.png


The price is consolidating between the levels 1.2456 - 1.2322. The main intraday target is the nearest resistance at 1.2500 - 1.2537. If a pullback from this area happens little later on, there'll be an opportunity to have a decline towards the next support at 1.2358 - 1.2322.

1517399526-278624f2d60ce19d637692f1ba3bf63a_1200x1200_q90v3.png


There's a "V-Top" pattern, so the pair is likely going to test the 55 Moving Average. If a pullback from this line happens, bulls will probably try to reach another resistance at 1.2500 - 1.2537.

More:
https://fbs.com/analytics/articles/...ampaign=EN_English&utm_content=Riki_Analytics
 
GBP/USD Daily Analytics
11:56 31.01.2018

1517399526-944c5d8e4b0867c3cbc994d7c9e71684_1200x1200_q90v3.png


The 34 Moving Average has acted as support, so there's a "Double Bottom" pattern. In this case, the price is likely going to achieve the closest resistance area at 1.4284 - 1.4344.

1517399526-0b0a8e6c863a4fef1d57577dc40eb837_1200x1200_q90v3.png


There's a local "V-Top" pattern, so the pair is likely going to test the 89 Moving Average. This line could be a departure point for an upward price movement in the direction of the next resistance at 1.4284 - 1.4344.

More:
https://fbs.com/analytics/articles/...ampaign=EN_English&utm_content=Riki_Analytics
 
EUR/USD Daily Analytics
12:00 31.01.2018

1517399943-59ef0da97269127d19a7625f0bc2d492_1200x1200_q90v3.png


The last "Tweezers" and "Hammer" patterns are still on the table, cause there isn't any reversal model so far. In this case, the market is likely going to continue moving higher in the short term.

1517399943-3ba776d3255949a389df591b03e17fc9_1200x1200_q90v3.png


The 34 & 55 Moving Averages have acted as support. Also, there's a bullish "Three Methods" pattern, so the market is likely going to reach the next resistance area soon.

More:
https://fbs.com/analytics/articles/...ampaign=EN_English&utm_content=Riki_Analytics
 
USD/JPY: FLAT UNDER MOVING AVERAGES
12:03 31.01.2018

1517399944-a8b21ccaa0161fdf2a5a8fab5bdbfbe8_1200x1200_q90v3.png


The price is consolidating under the Moving Averages. There isn't any confirmed bullish pattern, so the pair is likely going to continue moving lower towards the next "Window".

1517399943-f993ece5ba56d9ebd439c6ecd265103e_1200x1200_q90v3.png


There's a "High Wave" pattern, so the price is likely going to test the nearest upper "Window". If a pullback from this level happens little later on, we could have another decline.

More:
https://fbs.com/analytics/articles/...ampaign=EN_English&utm_content=Riki_Analytics
 
WHAT IS PMI AND WHY IS IT IMPORTANT?


Purchasing Managers’ Index (PMI) is an indicator that measures the economic health of the manufacturing sector. The aim of the Index is to provide information about current business conditions to company analysts, purchasing managers, decision makers.
Learn more on this interesting article https://goo.gl/MxM2BV

PMI in the Economic Calendar
How is the information gathered?
Why is it so important?

xy1hnlv1cmz912vjm1xk.jpg
 
USD/JPY Daily Analytics
06:37 01.02.2018

Technical levels: support – 108.50; resistance – 110.00.

Trade recommendations:

Sell — 110.00; SL — 110.20; TP1 — 109.00; TP2 — 108.50.
Reason: narrowing bearish Ichimoku Cloud with rising Senkou Span A; a cancelled dead cross of Tenkan-sen and Kijun-sen, the lines are horizontal; the prices have grown to the bottom border of the Cloud.

1517466914-3dcc4d3b0e9d38341d309e86e7227f36_1200x1200_q90v3.png


More:
https://fbs.com/analytics/articles/...ampaign=EN_English&utm_content=Riki_Analytics
 
EUR/JPY Daily Analytics
07:23 01.02.2018

Recommendation:

BUY 136.25

SL 135.70

TP1 137.25 TP2 138.10

On the daily chart, EUR/JPY retested the upper border of the previous consolidation range of 131.50-134.30. This and the following formation of a pinbar will allow bulls to return initiative. The necessary condition to continue advance towards 127.2% of the AB=CD pattern is the confident test of resistance at 136.25.

1517469652-151f939c6df1fdb4a28b3d5785d898f1_1200x1200_q90v3.png


On H1, EUR/JPY the inability of bears to lead the pair below 38.2% of the last bullish wave points at their weakness. A break of resistance at 136.25 will open the way to the upside.

1517469672-b35d7fb0c22de42ad09055593ba2f9a4_1200x1200_q90v3.png


More:
https://fbs.com/analytics/articles/...ampaign=EN_English&utm_content=Riki_Analytics
 
USD/JPY Daily Analytics
08:27 01.02.2018
Recommendations:

SELL 110.1 SL 110.65 TP 109.10 TP2 108.20

SELL 110.65 SL 111.2 TP1 109.65 TP2 108.65

On the daily chart, a natural pullback happened after USD/JPY reached 88.6% target of the “Bat” pattern. If bears manage to hold the pair within inside the downward trading channel, chances of a sharp decline’s continuation will increase substantially.

1517473593-3297c54597baddc0779dab87f73568a2_1200x1200_q90v3.png


On the hour chart, a break of resistance at 109.50 will increase the risks of activation of the “Shark” pattern with a target of 88.6%. In an obvious bearish trend, rebounds from levels of 110.05-110.15 and 110,65 should be used for selling.

1517473615-1f50b4d918123f905c31c70a9dfda50a_1200x1200_q90v3.png


More:
https://fbs.com/analytics/articles/...ampaign=EN_English&utm_content=Riki_Analytics
 
EUR/USD Daily Analytics
12:25 01.02.2018

1517487855-159e2454640d6b25cbc50f048398d9bf_1200x1200_q90v3.png


The main trend is still bullish, but the price is consolidating. It's likely that the market is going to test the nearest resistance at 1.2500 - 1.2537. If a pullback from this area happens little later on, there'll be an opportunity to have a decline towards the closest support at 1.2456 - 1.2358.

1517487855-e176175194be4a178c1be19327dea290_1200x1200_q90v3.png


The pair is consolidating between the levels 1.2456 - 1.2384. The main intraday target is the next resistance area at 1.2493 - 1.2537, which could be a departure point for a bearish correction.


More:
https://fbs.com/analytics/articles/...ampaign=EN_English&utm_content=Riki_Analytics
 
GBP/USD Daily Analytics
12:27 01.02.2018

1517487855-53c51b36b1acc2fcf484907612a40561_1200x1200_q90v3.png


There's a "Double Bottom", so the market is likely going to reach the closest resistance at 1.4344. If a pullback from this level happens afterwards, there'll be a moment to have a downward correction.

1517487855-108b91da64ce255c9020d1867bc88015_1200x1200_q90v3.png


Bulls faced resistance at 1.4284, but the market is likely going to continue moving higher in the short term. The main intraday target is the next resistance at 1.4344 - 1.4386

More:
https://fbs.com/analytics/articles/...ampaign=EN_English&utm_content=Riki_Analytics
 
EUR/USD: BULLISH "HAMMER" ON THE 55 MA
12:30 01.02.2018

1517488154-783a7d8119ca874b8c92c5b9de518c01_1200x1200_q90v3.png


The 21 Moving Average acted as support, so there're a "Tweezers" and a "High Wave" patterns. In this case, the market is likely going to continue rising towards the last high.

1517488154-4e76bff1f63c910057d548a13d978e41_1200x1200_q90v3.png


There's a bullish "Hammer", which has been formed on the 55 Moving Average. Therefore, bulls are likely going to achieve the next resistance area in the short term.

More:
https://fbs.com/analytics/articles/...ampaign=EN_English&utm_content=Riki_Analytics
 
EUR/JPY: BULLS KEEP ON PUSHING
07:23 01.02.2018

Recommendation:

BUY 136.25

SL 135.70

TP1 137.25 TP2 138.10

On the daily chart, EUR/JPY retested the upper border of the previous consolidation range of 131.50-134.30. This and the following formation of a pinbar will allow bulls to return initiative. The necessary condition to continue advance towards 127.2% of the AB=CD pattern is the confident test of resistance at 136.25.

xkvxrtykamw3piwybmu2l.png


On H1, EUR/JPY the inability of bears to lead the pair below 38.2% of the last bullish wave points at their weakness. A break of resistance at 136.25 will open the way to the upside.

xld2vvtd9fvix1ebw66.png


More:
https://goo.gl/mFHxLF
 
DOES THE POUND HAVE CHANCES FOR FURTHER STRENGTHENING?
14:20 01.02.2018

The pound rose from 1.35 versus the US dollar at the start of the year to 1.4345 on January 25. Then there was a pullback down, but starting from Wednesday, January 31, GBP/USD once again headed up. As a result, British currency showed in January its best monthly performance since May 2009.

1517494802-f4b658a485febed9dfa293b578b7737c_1200x1200_q90v3.png


The rise happened because of the several reasons. First of all, the weaker US dollar has been supporting the rise of many currencies during a long period. The pound added than 5% since the start of the year, while the dollar is near its 3-year lows against major currencies. Analysts say that the advance of GBP/USD is more the result of the market selling dollars than buying pounds.

The second reason is positive prospects for a Brexit deal that was supported by domestic economic developments and comments of the Bank of England’s Governor Mark Carney.

The general sentiment about Brexit is positive since the start of the year. The market believes that the country will be able to reach a favorable deal with its European partners. The talks are proceeding with some difficulties though. According to Reuters, EU officials don’t want to allow finance companies to operate in each other’s markets without barriers if Britain leaves the single market. A report was leaked this week that Brexit will bring negative consequences to the UK economy, no matter whether it leaves the European Union with a free trade deal, single market access or without any deal at all.

However, so far positive comments of BOE Governor Mark Carney have shielded the pound from the Brexit-related uncertainty. Sterling rose on Tuesday after he said that the country’s economy has recovered from the financial crisis. Mr. Carney said that private sector is gradually firming and a rise in wages over the next few years appeared to be on track. All this allows the bank to occupy itself with bringing down inflation. As a result, many analysts now think that the BOE will raise interest rates faster than expected. The first 2018 policy decision of BOE will be announced on Thursday, February 8. Before this Services PMI will be released on Monday, February 5.

Some analysts have already changed their long-term forecasts for the pound. For example, HSBC increased the year-end projection for GBP/USD from $1.26 to $1.34. UniCredit now thinks that the pound will end 2018 at $1.49. Their previous estimate was by 9% lower. BMO Capital Markets predicted GBP/USD at $1.45 last October, but, nowadays, they forecast $1.52 if the dollar continues to weaken and the UK economy keeps growing.

At the same time, there are experts who think that the pound has gained too much in the short-term and that this growth is not fully justified. Commerzbank believes that there will be a lot of problems in Brexit negotiations. According to the bank, Carney will recognize Brexit-related risks and will discourage the rate hike expectations next week. That’s why Commerzbank is cautious about buying GBP at the current levels.

More:
https://fbs.com/analytics/articles/...ampaign=EN_English&utm_content=Riki_Analytics
 
USD/JPY: BULLS FOLLOW A SHARK
08:27 01.02.2018

Recommendations:

SELL 110.1 SL 110.65 TP 109.10 TP2 108.20

SELL 110.65 SL 111.2 TP1 109.65 TP2 108.65

On the daily chart, a natural pullback happened after USD/JPY reached 88.6% target of the “Bat” pattern. If bears manage to hold the pair within inside the downward trading channel, chances of a sharp decline’s continuation will increase substantially.

xi7wswznm9j5ctswh68bl.png


On the hour chart, a break of resistance at 109.50 will increase the risks of activation of the “Shark” pattern with a target of 88.6%. In an obvious bearish trend, rebounds from levels of 110.05-110.15 and 110,65 should be used for selling.

xldru2gnqtuz76ght5tc.png


More:
https://goo.gl/Jq5Hs6
 
Top