• The Forex, Binary Options Forum - welcomes you to our Community!

    DigitalCashPalace Forum is dedicated to discussions about Forex, Binary Options, commodities, stocks related.

    Please take a look around, and feel free to .

Market analysis and trade recommendations by FBS

EUR/JPY Daily Analytics
07:46 11.01.2018
Recommendation:

SELL 133.05

SL 133.60

TP1 132.05 TP2 131.5

On the daily chart, EUR/JPY is trading in the “Shakeout-Fakeout” pattern. After reaching 161.8% target of AB=CD the pair returned inside the previous consolidation range of 131.50-134.30. A break of the lower border of an uptrend will increase the risks of correction to the long-term bullish trend.

1515656628-8afba167b3e7c15d0d5d28d0f3c7b966_1200x1200_q90v3.png


On H1, a successful test of support at 133.05 will allow bears to trigger the “Shark” pattern and make the pair go to 88.6%.

1515656674-144c086f9efd0dd7367f2818eb875c0e_1200x1200_q90v3.png


More:
https://fbs.com/analytics/articles/eur-jpy-bulls-went-to-the-stable-6175
 
USD/JPY Daily Analytics
07:57 11.01.2018
Recommendation:

BUY 112.80

SL 112.25

TP1 113.70 TP2 115.20

On the daily chart, USD/JPY bears managed to lead the pair outside of the uptrend channel. Together with this, reaching 78.6% of the Gartley pattern will allow bulls to seize the initiative. For a start, buyers need to settle above an important level of 111.65 yen.

1515657393-3297c54597baddc0779dab87f73568a2_1200x1200_q90v3.png


On H1, USD/JPY bulls are hoping for a “Shakeout-Fakeout” pattern. For that, they need to return the pair to the middle of the previous consolidation range of 112.05-113.65.

1515657412-1f50b4d918123f905c31c70a9dfda50a_1200x1200_q90v3.png


More:
https://fbs.com/analytics/articles/usd-jpy-bulls-retreat-but-don’t-give-up-6176
 
EURUSD Daily Analytics
12:34 11.01.2018

1515674009-07b2541c589ff5311ce4bcb9ed6e76dc_1200x1200_q90v3.png


Bulls faced with resistance at 1.2033, so there's a "V-Top" pattern. The main intraday target is the next support at 1.1884 - 1.1875. If a pullback from this area happens little later on, there'll be a moment to have an upward price movement towards another resistance at 1.1975 - 1.2003.

1515674009-82e5e4d66058758c92afb26ef791166d_1200x1200_q90v3.png


All the Moving Averages have been broken, so the price is consolidating. It's likely that the market is going to reach the 89 Moving Average in the short term. If a pullback from this line happens, bears will probably try to achieve the nearest support at 1.1890 - 1.1871.

More:
https://fbs.com/analytics/articles/eurusd-v-top-pattern-6186
 
USD/JPY Daily Analytics
12:39 11.01.2018

1515674235-3ea6d006b58de7201cee1efd94eb2f64_1200x1200_q90v3.png


There's a bearish "Harami" pattern, which has been formed under the nearest resistance area. So, we should keep an eye on the closest support area as an intraday target.

1515674235-e3bc0a8d5efdf772d22526a50b0cfed2_1200x1200_q90v3.png


The last "Shooting Star" pattern has been confirmed, so the current bullish correction is likely over. In this case, there's an opportunity to have another decline in the direction of the lower "Window".

More:
https://fbs.com/analytics/articles/usd-jpy-bearish-harami-pattern-6187
 
EURUSD Daily Analytics
12:43 11.01.2018

1515674235-d0ad83edac6a5fcc05af61691e2681e0_1200x1200_q90v3.png


There's a bearish "Harami", which has been formed at the last local high. Therefore, the pair is likely going to test the lower "Window" in the short term.

1515674235-d1b2d3fa369e8aaecf8b4f8b6ebe6ba1_1200x1200_q90v3.png


We've got a bullish "Hammer", but this pattern hasn't been confirmed yet. So, it seems like we're going to have just a local correction towards the Moving Averages.

More:
https://fbs.com/analytics/articles/eurusd-bearish-harami-6188
 
THE UNCERTAINTY OF GOLD IN 2018
14:02 11.01.2018

1515679094-afa1ef161e74c54afa0e9a4b29b8e5b1_1200x1200_q90v3.png


According to the weekly chart, gold started 2018 with the highest price from the middle of September 2017 and according to the monthly chart, the highest January opening price since 2013.

1515679115-e183572055cc9195960b6502f71e564b_1200x1200_q90v3.png


It gave a reason to a lot of economists and analysts to predict a rise of gold in 2018. Mostly, they consider the current policy and situation. For example, Commerzbank talks about the loose monetary policy of nearly all key Central Banks and political uncertainty, predicting the price of $1,325 an ounce in 2018. The thing is that the political uncertainty was related to the coming U.S. tax reform that was actual at that time, but uncertainties are already passed.

However, the question of the price cannot be based just on the current events. The price depends on a lot of factors and especially on the dollar where the Federal Reserve System plays one of the main roles.

Most of the economists, metal analysts take into account the Fed, they expect that actions of the Fed will lead to the strengthening of dollar and gold will lose its position. They suppose that gold will not be needed as a safe haven soon because of the stabilization of risks and tighter monetary policy. Based on this, a lot of economists predict the great fall of gold to $1,200 per ounce, that is really low comparing to the numbers it had at the beginning of the year.

To conclude all of the above, the situation with gold in 2018 is unclear. It depends on a lot of factors. The key points that will affect the dollar and gold in pair with it are: how much time it will take for developed economies to normalize interest rates, what is the impact of the tax reform, when inflation will start to increase and to what extent the Fed will tighten its policy.

More:
https://fbs.com/analytics/articles/the-uncertainty-of-gold-in-2018-6190
 
CRUDE OIL IN 2018: IS IT REALLY A BULLISH TREND?
14:14 11.01.2018
Background
Let’s look at the background of the price dynamics.

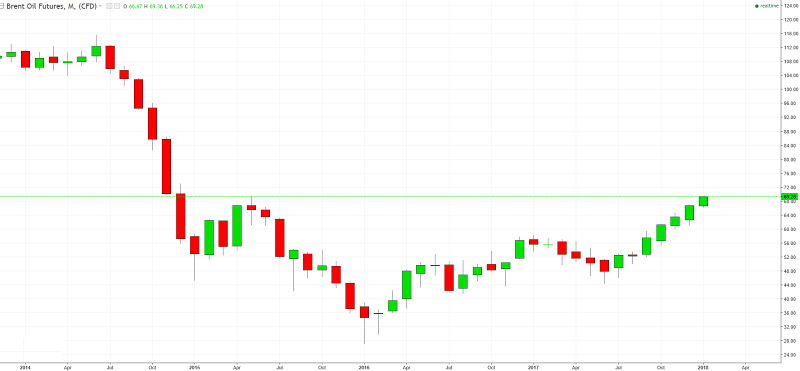
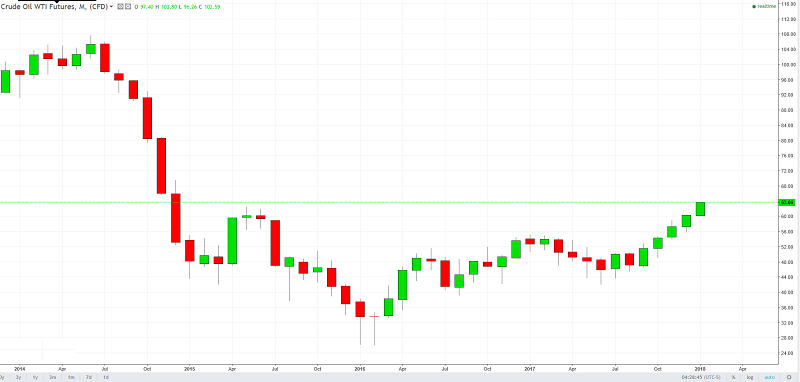
The great fall of the oil price happened in 2014. It was caused by the increased oil production in the USA and Canada. American private companies started extracting oil from shale formations in North Dakota. At the same time, Canada started extracting from oil sands that are the world’s third-largest crude oil reserve. That local production caused the shortage of the oil demand from these countries, increased oil supply and led to the fall of the oil price. The important fact is that OPEC, the leader of the oil sphere, refused to cut its oil production letting prices fall. The dynamics you can see on charts below.

1515680392-5918e36c9c385a5e3559b27829eaa07f_1200x1200_q90v3.png


1515680412-7baa99b0e0cf6e02edc067cfc1b55624_1200x1200_q90v3.png


Positive trend
Changes began only in 2016 when OPEC and Russia agreed to shorten the oil extract. After that agreement prices started to increase slowly, not without falls, but the great fall never happened after anymore.

As we can see from the charts, prices of both the major oil brands - Brent and WTI - are rising from September 2017. Now prices at the highest closing levels since December 2014.

This trend gave a reason to analysts and economists to make positive predictions about the future of the prices. Nevertheless, it is important to take into account a lot of factors that had an impact on the price, especially at the end of December 2017: strikes in Iran, the explosion at a major oil pipeline in Libya, scandals in Saudi Arabia. All those events caused the rise of the prices, but there can be factors that can direct the trend in the opposite way in 2018.

What can affect prices in 2018
However, nothing can be absolutely clear, there are factors that can affect the oil price in 2018. If only supply and demand remain nearly balanced, the price will rise.

First of all, OPEC and Russia have to continue their cutting policy that has such a positive impact on the oil price. If only countries decide to change the policy and come back to the same amount of oil they extracted before, the price will fall again.

Secondly, some economists suppose that the USA can continue extracting oil because of increasing price that can lead to the fall of price.

Speculations are important fact as well. For example, Torbjorn Kjus, chief oil analyst at DNB Bank ASA, assumed that crude can soon see a speculator-driven slump because of a record number of bullish bets at the beginning of 2018.

A lot of political events can affect oil price in 2018. For example, cutting of oil extracting in Venezuela, scandals in Saudi Arabia and an unstable political environment in Iran.

Summing up all factors that can influence oil price in 2018, we can say that it is complicated to predict the price of crude oil in 2018. Some of the events can lead to the rise of the price, some of them to the fall. However, most of the economists agree on the price from $50 to $70 per barrel.

oil

More:
https://fbs.com/analytics/articles/crude-oil-in-2018-is-it-really-a-bullish-trend-6192
 
EUR/USD Daily Analytics
07:36 12.01.2018
Recommendation:

BUY 1.2125

SL 1.2070

TP1 1.2240 TP2 1.2280

On the daily chart, EUR/USD is resuming the uptrend. If resistance at 1.2090-1.2115 doesn’t stop the bulls, the odds of the rally’s continuation to 1.2240-1.2280 will significantly increase. The nearest support is near 1.1995.

1515742487-8afba167b3e7c15d0d5d28d0f3c7b966_1200x1200_q90v3.png


On H1, EUR/USD may stop at the current levels, there may be a break towards 161.8% target of the “Crab” pattern and formation of the “Widening wedge”. Traders should be cautious.

1515742508-144c086f9efd0dd7367f2818eb875c0e_1200x1200_q90v3.png


More:
https://fbs.com/analytics/articles/eur-usd-bulls-want-more-6205
 
EUR/GBP Daily Analytics
08:03 12.01.2018
Recommendation:

SELL 0.8810 SL 0.8865 TP1 0.871 TP2 0.845

BUY 0.8925 SL 0.887 TP1 0.9015 TP2 0.907

On the daily chart, EUR/GBP keeps consolidating within “Spike and ledge” pattern. We will be able to speak about the uptrend’s resumption if the pair rises above resistance at 0.9015. On the other hand, a break of support at 0.8740 will increase of correction towards 200% target of AB=CD.

1515744026-bc1ce4ebdd72b71af2881b8edc2b5fe5_1200x1200_q90v3.png


On H1, EUR/GBP is making a retest in line with “Head and shoulders” pattern. We can’t exclude the possibility of a “Widening wedge”.

1515744141-311438cdc50bb0f634d8ee27e47a0113_1200x1200_q90v3.png


More:
https://fbs.com/analytics/articles/eur-gbp-is-in-the-corridor-6206
 
THE WEEKLY REPORT: AUD/USD
10:02 12.01.2018
The Australian dollar is continuing to strengthen its position at the market. On Thursday 11 January 2018 it gained the highest level in three months.

1515750919-77792247dfb92d8a1910c0d72fd89ccb_1200x1200_q90v3.png


There were several reasons for such growth. First of all, the US dollar weakness during the week supported the Australian dollar. The Us dollar fell on Wednesday after the news about the willingness of China to stop purchasing US treasuries. The US dollar depreciated against all main currencies.

Another important event is the report of Australia’s retail sales for November. The rise of total sales was the highest since January 2013. The news stabilized the current state of household finances.

However, on Friday the Australian dollar started to lose positions a little bit because of the data that China released about its trade in December. According to the data, import increased much less than it was expected: 4,5% against 13,0%. This data affected demand perspectives in China – the biggest trade Australian partner. Because of this news the price of Aussie started to fall.

Nevertheless, the fall was not too big and at the time of writing of this report the price started to rise again, it gave a reason to make a positive forecast about the future growth of the Australian currency.

What can affect the rate next week is data about an unemployment rate and consumer inflation expectations on Wednesday 17 January in Australia.

AUD/USD is trying to settle above the 200-week at 0.7850. A weekly close above this line, will strengthen positions of AUD buyers. Yet, looking on the daily chart we can’t say that there’s a strong bullish momentum: moving averages are horizontal. They will offer support for the pair at 0.7770 and 0.7700. The pair still has substantial resistance located at 0.7900 and 0.8000.

More:
https://fbs.com/analytics/articles/the-weekly-report-aud-usd-6210
 
EURUSD Daily Analytics
11:57 12.01.2018

1515758177-2aa86a60e299de4d8a08c2132db80645_1200x1200_q90v3.png


There's a "Triple Bottom" pattern, which has been confirmed, so we've got a new local high. The main intraday target is the next resistance at 1.2164. If a pullback from this level happens, there'll be a moment for a bearish correction towards the nearest support at 1.2129 - 1.2080.

1515758177-e14656e11d178d8af297bce5d3b6b1f8_1200x1200_q90v3.png


The price has been rising since a "Triple Bottom" formed. It's likely that bulls are going to test the closest resistance at 1.2164, which could be a departure point for a downward correction.

More:
https://fbs.com/analytics/articles/eurusd-triple-bottom-pattern-6211
 
GBP/USD Daily Analytics
12:02 12.01.2018

1515758178-ab6b42530141ec7e604b8b5f926a98c3_1200x1200_q90v3.png


The main trend is still bullish, so the last high is likely going to be broken soon. The main intraday target is the next resistance at 1.3612 - 1.3656. If a pullback from these levels happens little later on, bears will probably try to test the closest support at 1.3569 - 1.3549.

1515758177-28fe31717e8232928cdbbf83b0c9a90d_1200x1200_q90v3.png


All the Moving Averages have been broken, so the price is rising. It seems like bulls are going to reach the next resistance at 1.3612 - 1.3656 in the coming hours. However, if a pullback from this area is on the table, we could have a correction in the direction of the nearest support at 1.3584 - 1.3549.

More:
https://fbs.com/analytics/articles/gbp-usd-main-trend-still-bullish-6212
 
EURUSD Daily Analytics
12:05 12.01.2018

1515758669-a337ba1cdb5fa875a057958d1e02a945_1200x1200_q90v3.png


The 55 Moving Average has acted as support, so the last "Doji" and "Hammer" patterns led to the current upward price movement. There's no any reversal pattern, so the price is likely going to continue moving up.

1515758669-25ef2c3c9d7fae250ce793bed4a49831_1200x1200_q90v3.png


There's a "Three Methods" pattern, so the price is rising. However, we could have a correction in the coming hours towards the nearest support area, which is likely going to be a departure point for another upward price movement.

More:
https://fbs.com/analytics/articles/eurusd-three-methods-pattern-6213
 
BITCOIN (BTC/USD)
19:15 14.01.2018
Bitcoin continues to consolidate slightly above the psychological level of 13,000 since buyers remain active at the Fibonacci level of 23.6% at 12,852.85. This has allowed the bears to weaken in the current movement and the Parabolic SAR seems to be supporting the price action in the short term in favor of the bulls.

During the weekend, the Russian finance minister proposed that the cryptocurrency trading is legalized once and for all, due to the wide popularity that this activity has gained in the country. It is interesting to note that companies with international remittances such as MoneyGram are implementing the XRP in their internal pilot program systems.Now bulls and bears are locked in a battle to guide the path of the BTC / USD pair in the short term, although the long-term view is still bullish. We say this because of the fact that cryptocurrency has still not moved significantly away from the 200-hour moving average, which supports the bullish price action for the time being.

What do we expect?

Our forecasts in the short term continue to put Bitcoin in a bearish trend that can be strengthened with the break of 12,852. This could allow our hypothesis raised in days ago to be fulfilled and the pair will reach the Fibonacci target of -23.6% in 8507.14. The RSI remains in negative territory, although it is entering a neutral zone

1515957275-4d569cef72bb7acd467357c14ba1575a_1200x1200_q90v3.png


More:
https://fbs.com/analytics/articles/bitcoin-btc-usd-buyers-demand-around-12850-6226
 
EUR/NZD
19:16 14.01.2018
EUR/NZD has been trading in a bearish tone since January 3rd session, but so far it’s consolidating above the 200 SMA, at which is currently finding sellers. The 65% Fibonacci level could act as a resistance that help to strengthen the downward path for the short-term. If that happens, the pair could be on its way to test the -23.6% Fibo zone at 1.6400.

RSI indicator is moving in the overbought territory.

1515957363-c876ab27ae85b67f4e154cf934bae270_1200x1200_q90v3.png


More:
https://fbs.com/analytics/articles/eur-nzd-under-selling-pressure-at-16830-6227[URL="http://"][/URL]
 
EURUSD Daily Analytics
03:40 15.01.2018


1515987514-62bbfb3c9e08728858ca2cc43b45424e_1200x1200_q90v3.png


The price went through an important resistance at 1.2080 - 1.2129, but bulls are likely going to test the next resistance at 1.2246. If a pullback from this level happens little later on, there'll be a moment to have a downward correction towards the nearest support at 1.2129 - 1.2080.

1515987514-19a254812556f6c4c81ff388ccc0a389_1200x1200_q90v3.png


Bulls faced with resistance at 1.2225, so there's time for a local bearish correction. The main intraday target is the closest support at 1.2164. This level could be a departure point for another upward price movement in the direction of the next resistance at 1.2225 - 1.2246.

More:
https://fbs.com/analytics/articles/eurusd-bulls-going-to-test-next-resistance-6229
 
GBP/USD Daily Analytics
03:44 15.01.2018

1515987514-d69fcaf5bbcc48089fbbbf947af31dbe_1200x1200_q90v3.png


The main trend is still bullish. It's likely that the pair is going to test the next resistance at 1.3765 - 1.3834 in the short term. However, if a pullback from this area happens little later on, there'll be an opportunity to have a bearish correction towards the nearest support at 1.3635.

1515987514-edcd3d3a6a7091f81b907fd3864ce2b8_1200x1200_q90v3.png


The pair faced with resistance at 1.3765, so bears are likely going to test the closest support at 1.3692 - 1.3656 in the coming hours. Meanwhile, if a pullback from this area happens afterwards, we could have another upward price movement in the direction of the next resistance at 1.3765 - 1.3834.

More:
https://fbs.com/analytics/articles/gbp-usd-v-bottom-led-to-new-high-6231
 
Top