• The Forex, Binary Options Forum - welcomes you to our Community!

    DigitalCashPalace Forum is dedicated to discussions about Forex, Binary Options, commodities, stocks related.

    Please take a look around, and feel free to .

Market analysis and trade recommendations by FBS

EUR/USD Daily Analytics
12:05 07.12.2017

1512648255-74460bc303f3cf9d4fe88aee6fd4e9d8_1200x1200_q90v3.png


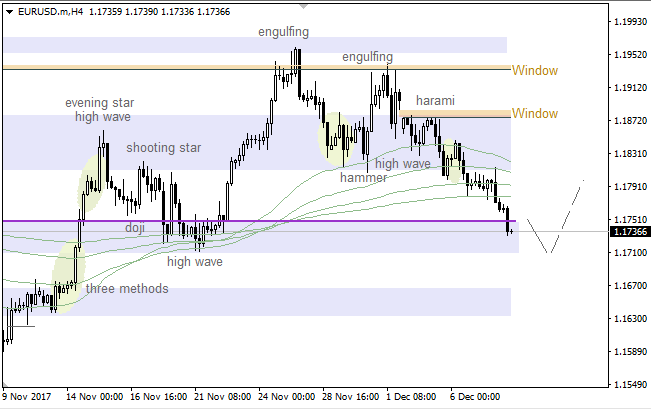
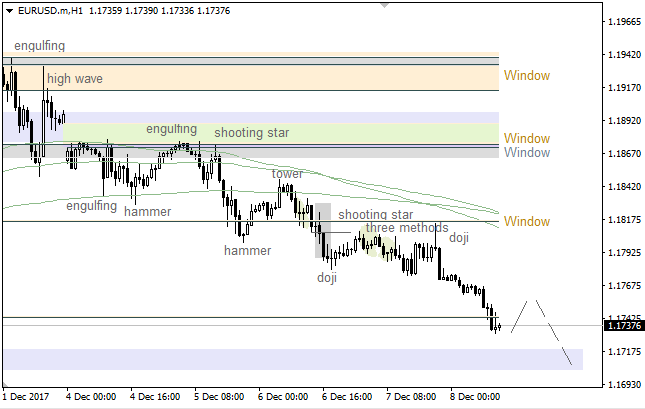
It seems like wave 5 is going to take the form of an ending diagonal pattern. So, if a pullback from 5/8 MM Level happens, there'll be an opportunity to have wave [iii]. The main intraday target is +2/8 MM Level.

1512648255-d78867cf211ec7d6058844ec9acd1d1d_1200x1200_q90v3.png


There's a pullback from 2/8 MM Level, so an ending diagonal in wave (c) might have been formed. In this case, we could have an upward impulse in wave (a) soon. Therefore, we should keep an eye on 6/8 MM Level as the next bullish target.

More:
https://fbs.com/analytics/articles/eur-usd-ending-diagonal-pattern-5563
 
EUR/AUD Daily Analytics
14:09 07.12.2017
EUR/AUD reversed from support zone
Next buy target - 1.5760
EUR/AUD continues to rise inside the sharp minor impulse wave (iii) – which recently reversed up from the support area lying between the key support level 1.5500 (which stopped the previous minor correction ii), upper trendline of the recently broken daily up channel from September (acting as support after it was broken earlier) and the 38.2% Fibonacci correction of the previous impulse (i). EUR/AUD is expected to rise to the next buy target at the next resistance level 1.5760 (top of the impulse (i)).

GX793cc.png


More:
https://fbs.com/analytics/articles/eur-aud-reversed-from-support-zone-5565
 
GBP/AUD Daily Analytics
14:10 07.12.2017

GBP/AUD reversed from support zone
Next buy target - 1.7900
GBP/AUD recently reversed up with the daily Hammer from the support area lying between the key support level 1.7600 (which reversed the previous impulse wave (iii) in November as can be seen below) and 38.2% Fibonacci correction of the previous minor impulse wave from October. GBP/AUD is expected to rise to the next buy target at the next resistance level 1.7900 (which reversed the previous sharp minor impulse wave (iii)).

GX79wjN.png


More:
https://fbs.com/analytics/articles/gbp-aud-reversed-from-support-zone-5566
 
EUR/USD Daily Analytics
07:57 08.12.2017

Recommendation:

SELL 1.1755

SL 1.1810

TP 1.1640 TP2 1.1600 TP3 1.1550

On the daily chart, EUR/USD bears managed to lead the pair outside of the uptrend channel and conquer support at 1.1820. If the bulls’ fortress near 1.1757 fails under their attack, the odds of getting to 127.2% and 161.8% targets of the “Crab” pattern will increase.

1512719702-8afba167b3e7c15d0d5d28d0f3c7b966_1200x1200_q90v3.png


On H1, a break below support at 1.1758-1.1759 will created grounds for triggering the “Shark” pattern. Its 88.6% target is near 1.1600. On the other hand, the pullback from an important level will lead to consolidation in the 1.1750-1.1950 area.

1512719727-144c086f9efd0dd7367f2818eb875c0e_1200x1200_q90v3.png


More:
https://fbs.com/analytics/articles/eur-usd-euro-is-catching-a-crab-5577
 
EUR/GBP Daily Analytics
08:19 08.12.2017
Recommendation:

SELL 0.8765

SL 0.882

TP1 0.8665 TP2 0.8525 TP3 0.844

On the daily, EUR/GBP bears managed to lead the pair outside of the long-term uptrend channel. As a result, the odds of the pair reaching 200% target of AB=CD increased. A successful test of support at 0.8693 is a necessary condition for the decline.

1512720946-bc1ce4ebdd72b71af2881b8edc2b5fe5_1200x1200_q90v3.png


On H1, EUR/GBP keeps forming the “Head and shoulders” pattern. The retest of resistance at 0.8765 (used to be a support) may be used for forming short positions.

1512720966-311438cdc50bb0f634d8ee27e47a0113_1200x1200_q90v3.png


MoreL:
https://fbs.com/analytics/articles/eur-gbp-pound-is-taking-the-initiative-5579
 
AUD/USD Daily Analytics
08:23 08.12.2017
Technical levels: support – 0.7500; resistance – 0.7550

Trade recommendations:

Sell — 0.7550; SL — 0.7570; TP1 — 0.7500; TP2 — 0.7480.
Reason: bearish Ichimoku Cloud with falling Senkou Span B; a dead cross of Tenkan-sen and Kijun-sen, but the lines are horizontal; the prices made a new lows, but the market is oversold and expected a correction to Tenkan-sen.

1512721411-42a68b4bfa2f0515dfbaa054e9dbae66_1200x1200_q90v3.png


More:
https://fbs.com/analytics/articles/aud-usd-aussie-will-correct-to-tenkan-5580
 
USD/JPY Daily Analytics
08:27 08.12.2017
Technical levels: support – 112.80; resistance – 113.50.

Trade recommendations:

Sell — 113.50; SL — 113.70; TP1 — 112.80; TP2 — 112.50.
Reason: expanding bullish Ichimoku Cloud with rising Senkou Span A; a golden cross of Tenkan-sen and Kijun-sen, with rising lines; the prices are under strong resistance and the market is overbought.

1512721411-3dcc4d3b0e9d38341d309e86e7227f36_1200x1200_q90v3.png


More:
https://fbs.com/analytics/articles/usd-jpy-dollar-breaking-out-ssb’s-resistance-5581
 
EUR/USD Daily Analytics
11:46 08.12.2017

1512733505-04fdd510dd2c8c62421d038d2477b181_1200x1200_q90v3.png


Bears faced with support at 1.1734, but the market is likely going to continue declining. The main intraday target is the nearest support at 1.1712 - 1.1695. If a pullback from this area happens, we could have an upward price movement towards the closest resistance at 1.1776 - 1.1792.

1512733505-3e76ed3aec0f02877499123ec465e793_1200x1200_q90v3.png


Considering that the price found support at 1.1734, there's an opportunity to have a bullish correction. Meanwhile, if a pullback from the nearest resistance at 1.1756 happens little later on, bears are likely going to reach the next support at 1.1712 - 1.1695.

More:
https://fbs.com/analytics/articles/eur-usd-market-going-to-continue-declining-5584
 
GBP/USD Daily Analytics
11:50 08.12.2017

1512733505-2282de02cdc8e046c9e85a9995394d8b_1200x1200_q90v3.png


There's a "Thorn" pattern, which has been confirmed, so the price is likely going to test the nearest resistance at 1.3549 - 1.3569. If a pullback from this area happens, we could have a decline towards the closest support at 1.3454.

1512733505-871d1b36daecf2de4b86e9533a0653d6_1200x1200_q90v3.png


The market is consolidating between the levels 1.3513 - 1.3454. If we see a pullback from the nearest resistance at 1.3513, there'll be an opportunity to have a downward price movement in the direction of another resistance at 1.3549 - 1.3569.

More:
https://fbs.com/analytics/articles/gbp-usd-thorn-pattern-5585
 
EUR/USD Daily Analytics
12:09 08.12.2017

1512734860-d83625c426f4b2e2922638209b12bb5d_1200x1200_q90v3.png


There's still no any confirmed reversal pattern, so all the last candles are bearish. Therefore, the pair is likely going to continue declining towards the nearest support, which could be a departure point for a bullish correction.

1512734859-8ffadcf6ee04d96c4965ef928b6be666_1200x1200_q90v3.png


The price has been declining since a pullback from the upper "Window" formed. Considering that there's no any bullish pattern, the pair is likely going to continue declining until any reversal model arrives.

More:
https://fbs.com/analytics/articles/eur-usd-no-any-confirmed-reversal-pattern-5586
 
USD/JPY Daily Analytics
12:12 08.12.2017


1512734860-995ee909a1aa2c13fde00be210d62b26_1200x1200_q90v3.png


The pair has reached the upper "Window", but there isn't any reversal pattern so far. In this case, the market is likely going to continue moving up until any bearish candle model forms.

1512734860-0cc165fa86675a1cb477107a034dab07_1200x1200_q90v3.png


The last two "Three Methods" patterns pushed the market higher. There's no any bearish pattern, so the market is likely going to climb even higher in the coming hours.

More:
https://fbs.com/analytics/articles/usd-jpy-pair-reached-the-upper-window-5587
 
GBP/USD Daily Analytics
06:36 11.12.2017

Technical levels: support – 1.3380; resistance – 1.3420.

Trade recommendations:

Buy — 1.3430; SL — 1.3410; TP1 — 1.3490; TP2 — 1.3530.
Reason: bearish Ichimoku Cloud, rising Senkou Span A; a cancelled golden cross of Tenkan-sen and Kijun-sen, but the lines are horizontal; the prices in a cloudy area but there is a strong support on 1.3380.

1512974195-5838ef800660551113de2aff99712827_1200x1200_q90v3.png


More:
https://fbs.com/analytics/articles/gbp-usd-pound-returned-to-cloud-5611
 
USD/JPY Daily Analytics
06:38 11.12.2017
Technical levels: support – 112.80; resistance – 113.60.

Trade recommendations:

Sell — 113.50; SL — 113.70; TP1 — 112.80; TP2 — 112.40.
Reason: expanding bullish Ichimoku Cloud with rising Senkou Span A; a golden cross of Tenkan-sen and Kijun-sen; the prices are under the strong resistance near 113.50/60 and the market is overbought.

1512974196-3dcc4d3b0e9d38341d309e86e7227f36_1200x1200_q90v3.png


More:
https://fbs.com/analytics/articles/usd-jpy-dollar-is-overbought-5612
 
NZD/USD Daily Analytics
08:44 11.12.2017
Recommendation:

BUY 0.6910

SL 0.6855

TP 0.7010 TP2 0.7105 TP3 0.7170

On the daily chart, NZD/USD after fourth unsuccessful test of support at 0.6820-0.6825 returned to the upper border of the consolidation 0.6820-0.6910 range. A successful test of resistance at 0.6905-0.6910 will increase the risks of 88.6% target of the junior “Shark” pattern.

1512981764-fb9be1d9d65d6402746f6573306cf53b_1200x1200_q90v3.png


On H1, the inability of bears to lead the pair outside of the uptrend channel points at their weakness. Another test of resistance at 0.6905-0.9610 will lead the pair up to 161.8% target of the “Crab” pattern.

1512981779-3696dc2326705fd45dfa7b732beb8b1e_1200x1200_q90v3.png


More:
https://fbs.com/analytics/articles/nzd-usd-kiwi-prepared-for-takeoff-5616
 
EUR/USD Daily Analytics
10:54 11.12.2017

1512989578-d080d659370691e5a11623e0cb848203_1200x1200_q90v3.png


There's a bullish "Piercing Line", which has been confirmed, so the price is rising. Also, there's no any bearish pattern, which means the price is going to test the nearest resistance. If a pullback from this level happens little later on, there'll be an opportunity to have another decline.

1512989578-914f69ff9691038f8873ab4d1c2e6d0e_1200x1200_q90v3.png


We've got a "Tower" pattern, which has been formed at the last low. Considering that there's no any reversal pattern, the market is likely going to continue moving up towards the Moving Averages in the short term.

More:
https://fbs.com/analytics/articles/eur-usd-bullish-piercing-line-5621
 
USD/JPY Daily Analytics
10:57 11.12.2017

1512989578-aec57d5847c5e018cb8c930d4eaca54a_1200x1200_q90v3.png


The upper "Window" has acted as resistance, so there's a bearish "Harami" at the last high. Therefore, the pair is likely going to test the 21 Moving Average in the short term. If a pullback from this line happens afterwards, we could have another bullish price movement.

1512989578-bbe7b02dcb303aa2e5e0cfc8c8ec5aac_1200x1200_q90v3.png


We've got a bearish "Harami", which has been confirmed, so the price is declining. The main intraday target is the 55 Moving Average. If a pullback from this line happens little later on, there'll be an opportunity to have an upward price movement towards the last high.

More:
https://fbs.com/analytics/articles/usd-jpy-upper-window-acted-as-resistance-5623
 
XAU/USD Daily Analytics
07:41 12.12.2017

Recommendation:

SELL $1266

SL $1281

TP1 $1237 TP2 $1212

On the daily chart, a break of XAU/USD below the lower border of a $1266-1288 consolidation range allowed bears to get out. The target of 78.6% of the Gartley pattern is almost reached. The next one is 200% target of AB=CD. As long as gold is below 1266, sellers retain control of the market.

1513064283-20c6ebb86722ac92f8a505b7903a964b_1200x1200_q90v3.png


On H1, the exit outside of the descending trend channel with the following test of resistance at $1252 creates grounds for a pullback. It should be used for forming short positions.

1513064322-e12a637cc937326a9c7981d6dfc46909_1200x1200_q90v3.png


More:
https://fbs.com/analytics/articles/xau-usd-bears-got-out-5646
 
USD/CAD Daily Analytics
07:49 12.12.2017

Recommendation:

BUY 1.2885

SL 1.283

TP1 1.2985 TP2 1.313a TP3 1.325

On the daily chart, the inability of bears to hold USD/CAD below the lower border of the uptrend channel points at sellers’ weakness. To restore the uptrend and reach 88.6% target of the “Shark” pattern, bulls need to conquer resistance at 1.2922.

1513064856-1430b06b52ccdf0a9e951da31344610e_1200x1200_q90v3.png


On H1, return to resistance area at 78.6% and 88.6% of the wave 4-5 of the “Widening wedge” means that bulls are in control.

1513064872-5c726ce87bf89e31cdcfbd4c37b26a4a_1200x1200_q90v3.png


More:
https://fbs.com/analytics/articles/usd-cad-loonie-showed-wings-5647
 
EUR/USD Daily Analytics
12:01 12.12.2017

1513080005-5c82a1908d962f5dd16b7d9a05c98006_1200x1200_q90v3.png


There's a "V-Bottom" pattern, so the price is consolidating under the 55 Moving Average. The main intraday target is the nearest resistance area at 1.1828 - 1.1847. If a pullback from these levels happens little later on, there'll be an opportunity to have a decline towards the next support at 1.1772 - 1.1756.

1513080005-1affa06da5a94a5101ad5b15ad6a5fe7_1200x1200_q90v3.png


The price is consolidating near the 89 Moving Average. Also, there's a "Triple Bottom" pattern, so bulls are likely going to test the nearest resistance at 1.1828 - 1.1847. Meanwhile, if a pullback from this area arrives little later on, we could have a decline in the direction of another support at 1.1772 - 1.1756.

More:
https://fbs.com/analytics/articles/eur-usd-v-bottom-pattern-5651
 
GBP/USD Daily Analytics
12:16 12.12.2017

1513080005-d988bd9cadb115694cd1a1f1008b3d9e_1200x1200_q90v3.png


We've got a "V-Top", so the price is consolidating. The main intraday target is the closest resistance at 1.3408 - 1.3430. If the price forms a pullback from these levels, there'll be an opportunity to have a downward price movement towards the 89 Moving Average.

1513080005-a674316f29223fcc865be5fca160b71a_1200x1200_q90v3.png


Bears faced with support at 1.3336, which led to the current consolidation. It's likely that the pair is going to test the closest resistance at 1.3408 - 1.3430 in the coming hours. If a pullback from this area happens afterwards, bears will probably try to test the next support at 1.3319 - 1.3278.

More:
https://fbs.com/analytics/articles/gbp-usd-pair-going-to-test-closest-resistance-5652
 
Top