• The Forex, Binary Options Forum - welcomes you to our Community!

    DigitalCashPalace Forum is dedicated to discussions about Forex, Binary Options, commodities, stocks related.

    Please take a look around, and feel free to .

Market analysis and trade recommendations by FBS

XAU/USD: GOLD IS FALLING INTO ABYSS
07:14 17.10.2017

Recommendation:

SELL $1267

SL 1282

TP1 $1237 TP2 $1222 TP3 $1212

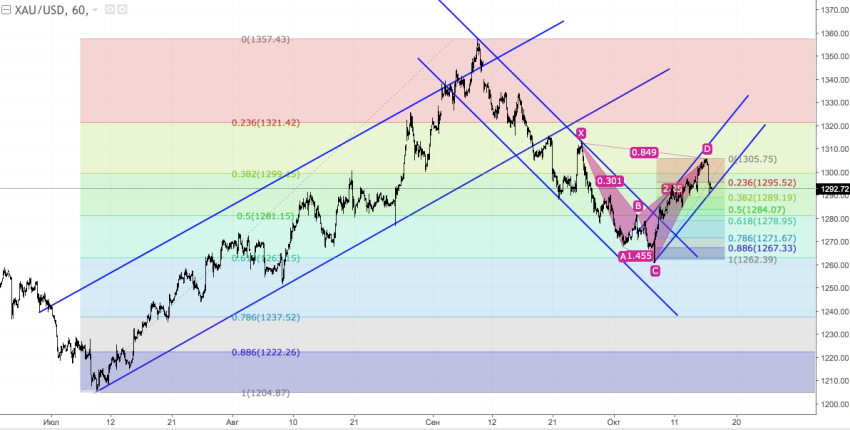
On the daily chart, the inability of bulls to overcome resistance at $1299-1302 an ounce points at their weakness. If sellers manage to trigger AB=CD, risks of continuation towards the 200% target will significantly increase.

1508224391-d8029dd1a750de79fab315e2c8c95412_1200x1200_q90v3.png


On H1, gold is correcting as the “Shark” pattern is transforming into 5-0. If bears want to return the quotes to support levels at 78.6% and 88.6% and conquer them, the continuation of the downtrend will become a reality.

1508224425-ec8be01d836e6a0db07525bf3cdc0f8c_1200x1200_q90v3.png


More:
https://fbs.com/analytics/articles/xau-usd-gold-is-falling-into-abyss-4436
 
USD/CAD: BULLS ARE READY FOR NEW HIGHS
07:45 17.10.2017

Recommendation:

BUY 1.256

SL 1.2505

TP1 1.2715 TP2 1.292 TP3 1.324

On the daily chart, bulls are trying to restore the short-term uptrend. They managed to defend their fortress near 1.2460. Now buyers are counting on growth towards 88.6% target of the inverted “Shark” pattern.

1508226203-1430b06b52ccdf0a9e951da31344610e_1200x1200_q90v3.png


On H1, USD/CAD formed a “Spike and ledge” pattern. The pair’s trading within the consolidation range of a ledge (1.2435-1.2560). A break of its upper border will strengthen the case for the uptrend to resume.

1508226221-5c726ce87bf89e31cdcfbd4c37b26a4a_1200x1200_q90v3.png


More:
https://fbs.com/analytics/articles/usd-cad-bulls-are-ready-for-new-highs-4437
 
EUR/USD: "DOUBLE TOP" PATTERN
09:14 17.10.2017

1508231595-33b3d91daf232fde458e4a3a3ccd9b10_1200x1200_q90v3.png


The last "Double Top" pattern led to the current decline. The main intraday target is the nearest support at 1.1745 - 1.1719. If we see a pullback from this area, there'll be an opportunity to have an upward price movement towards the closest resistance at 1.1822 - 1.1837.

1508231595-b1ef295d7227ec7fb9025bd03ad666b1_1200x1200_q90v3.png


There's a "Double Top" pattern, which has been formed under the Moving Averages. In this case, the market is likely going to test the next support at 1.1761 - 1.1738. If a pullback from these levels happens little later on, we could have an upward correction in the direction of the 34 Moving Average.

More:
https://fbs.com/analytics/articles/eur-usd-double-top-pattern-4441
 
GBP/USD: DEVELOPING "PENNANT" PATTERN
09:15 17.10.2017

1508231594-eea1d512e208c3d60c82063ffd0094ba_1200x1200_q90v3.png


We've got a local "V-Top", so the price is consolidating. Also, there's a possible "Pennant" pattern, so the pair is likely going to test another support at 1.3221 - 1.3150. Meanwhile, if we have a pullback from these levels, there'll be an opportunity to have a bullish price movement towards the closest resistance at 1.3342 - 1.3400.

1508231594-26b267c8f51da410469415e1d25fc835_1200x1200_q90v3.png


The price is still consolidating. Also, there's a possible developing "Pennant" pattern. Therefore, bears are likely going to test the nearest support at 1.3221 - 1.3202. If a pullback from this area happens, we should keep an eye on the nearest resistance at 1.3290 - 1.3342 as an intraday target.

More:
https://fbs.com/analytics/articles/gbp-usd-developing-pennant-pattern-4442
 
EUR/USD: DEVELOPING WAVE [II]
10:50 17.10.2017

1508237390-2a6a583e6c6a80abdbfeb3251a54af91_1200x1200_q90v3.png


The price is still declining, which means we should keep an eye on 0/8 MM Level as the nearest bearish target. If a pullback from this level happens, there'll be an opportunity to have another upward impulse in wave [iii].

1508237391-fe171ce898fcaa8cf37e3ddaf9268f2f_1200x1200_q90v3.png


There's a developing wave [ii], which hasn't been finished yet, so an impulse in wave (c) is likely going to be continued. The main intraday target is 0/8 MM Level, which could be a departure point for wave (i) of [iii].

More:
https://fbs.com/analytics/articles/eur-usd-developing-wave-ii-4443
 
USD/JPY: CONFIRMED BULLISH "HAMMER"
13:52 17.10.2017

1508248251-a04a3d1d9c8f856c51dec02e9c5fd05f_1200x1200_q90v3.png


The 89 Moving Average has acted as support, so we've got a "Hammer" and a "Tweezer" patterns. So, bulls are likely going to test the nearest "Window" in the short term.

1508248250-15c52d460568f9ed2f179bdb81e13aa7_1200x1200_q90v3.png


The last bullish "Hammer" has been confirmed. However, there's a pullback from the Moving Averages, so we could have a local correction during the day. Nevertheless, bulls will probably try to deliver a new local high afterwards.

More:
https://fbs.com/analytics/articles/usd-jpy-confirmed-bullish-hammer-4446
 
EUR/USD: "WINDOW" GOING TO ACT AS SUPPORT
13:54 17.10.2017

1508248251-d4b3f34e3e78d597d23a59a293f14d01_1200x1200_q90v3.png


The last bearish "Three Black Crows" led to the current decline. At the same time, there isn't any bullish pattern so far. In this case, the market is likely going to continue declining in the direction of the nearest support.

1508248251-33b2f8bde3bbaeb50eb7477410bb50b1_1200x1200_q90v3.png


The lower "Window" is likely going to act as support. If a pullback from this level happens, we could have an upward correction towards the Moving Averages.

More:
https://fbs.com/analytics/articles/eur-usd-window-going-to-act-as-support-4447
 
AUD/USD: AUSSIE SUPPORTED BY KIJUN-SEN
05:19 18.10.2017
Technical levels: support – 0.7830; resistance – 0.7915, 0.7955

Trade recommendations:

Buy — 0.7830; SL — 0.7810; TP1 — 0.7915; TP2 — 0.7955.
Reason: narrowing bearish Ichimoku Cloud, rising Senkou Span A; a cancelled golden cross of Tenkan-sen and Kijun-sen, but rising Kijun-sen; the prices are on the strong support of Kijun-sen and the market is left the local overbought area.

1508303972-42a68b4bfa2f0515dfbaa054e9dbae66_1200x1200_q90v3.png


More:
https://fbs.com/analytics/articles/aud-usd-aussie-supported-by-kijun-sen-4457
 
USD/JPY: BULLS TESTED SSA’S RESISTANCE
05:21 18.10.2017

Technical levels: support – 112.00; resistance – 112.40, 112.90.

Trade recommendations:

Buy — 112.20; SL — 112.00; TP1 — 112.90; TP2 — 113.40.
Reason: narrowing bearish Ichimoku Cloud with rising Senkou Span A; a new golden cross of Tenkan-sen and Kijun-sen with rising Tenkan-sen; the prices are supported by Tenkan-sen and Kijun-sen and will going to positive area.

1508303972-3dcc4d3b0e9d38341d309e86e7227f36_1200x1200_q90v3.png


More:
https://fbs.com/analytics/articles/usd-jpy-bulls-tested-ssa’s-resistance-4458
 
EUR/USD: PRICE GOING TO REACH NEXT SUPPORT
06:53 18.10.2017

1508309543-e3239a9c703ec1ac1416ba4a29b391db_1200x1200_q90v3.png


The price is still declining but bears faced with support at 1.1735, so there's a local consolidation. Nevertheless, the market is likely going to reach the next support at 1.1719 in the short term. If a pullback from this level happens, we could have an upward correction towards the nearest resistance at 1.1793 - 1.1822.

1508309543-291c090fba75706acaa4f88134b3442c_1200x1200_q90v3.png


The price is consolidating between the levels 1.1779 - 1.1761. It's likely that bulls are going to test the closest resistance at 1.1793, which could be a departure point for a decline in the direction of another support at 1.1735 - 1.1719.

More:
https://fbs.com/analytics/articles/eur-usd-price-going-to-reach-next-support-4461
 
GBP/USD: BEARISH "PENNANT" PATTERN
06:56 18.10.2017

1508309543-37110f0e49c2b5f2f3a94d79be184208_1200x1200_q90v3.png


There's a "Triple Top", so the price is consolidating. The main intraday target is the nearest support area at 1.3120 - 1.3081. Therefore, if a pullback from these levels happens little later on, there'll be an opportunity to have another bullish price movement towards the closest resistance at 1.3221 - 1.3290.

1508309543-ab3440c1aa865b4e1ab2c575dc348770_1200x1200_q90v3.png


There's a consolidation, which is taking place between the levels 1.3150 - 1.3202. Also, we've got a bearish "Pennant" pattern, so the pair is likely going to achieve the next support at 1.3120 - 1.3077. If a pullback from this area happens, bulls will probably try to reach the nearest resistance at 1.3150.

More:
https://fbs.com/analytics/articles/gbp-usd-bearish-pennant-pattern-4462
 
USD/CHF: FRANC IS DREAMING ABOUT A WEDGE
07:15 18.10.2017

Recommendation:

BUY 0.9805

SL 0.975

TP1 0.9875 TP2 0.9985

On the daily chart, USD/CHF keeps forming the reversal “Dragon” pattern. The main task of the bulls is to bring the quotes outside of the downtrend channel with the following test of resistance at 0.9830.

1508310831-a5903a7f3cf43bc4f33886526fd841ba_1200x1200_q90v3.png


On H1, there's a “Spike and ledge” pattern. A successful test of the upper border of the 0.9715-0.9805 consolidation range (“ledge”) will increase the odds of the downtrend’s resumption. On the other hand, a break of support at 0.9715 will trigger the reversal “Widening wedge” pattern.

1508310846-351a015a31e5fdb2fee97b43bc66aebc_1200x1200_q90v3.png


More:
https://fbs.com/analytics/articles/usd-chf-franc-is-dreaming-about-a-wedge-4463
 
GBP/USD IS BEING HUNTED
07:38 18.10.2017

Recommendation:

SELL 1.3155

SL 1.321

TP1 1.305 TP2 1.3 TP3 1.27

On the daily chart, GBP/USD keeps forming “Three Indians” pattern. Inability of the bulls to hold the pair above 1.3340 and 1.3265 is an indication of their weakness. Bears are ready for a new attack. In case of break below support at 1.3175 the risks of triggering AB=CD pattern with 200% target will increase.

1508311942-b6b56ed02b1869ac79ae2067aff9ca74_1200x1200_q90v3.png


On H1, if GBP/USD goes beyond the downtrend channel for the second time with the following test of support at 1.3155 will create ground for reaching 88.6% and 113% targets of the “Shark” pattern.

1508311958-2cf183d9aa99dd882e50bd88c66a58cb_1200x1200_q90v3.png


More:
https://fbs.com/analytics/articles/gbp-usd-is-being-hunted-4465
 
USD/JPY: BULLISH "HAMMER"
13:26 18.10.2017

1508333017-12ef2831e7a2f31fb0196dae3c629405_1200x1200_q90v3.png


The 55 Moving Average acted as support and we've got a "Three Methods" pattern, so the price is rising. It's likely that the pair is going to test the next resistance in the short term.

1508333017-a7be6b3d49005b9225cb33d57f818a54_1200x1200_q90v3.png


There's a bullish "Hammer", which has been formed at the last local low. The price reached the upper "Window", but there isn't any reversal pattern so far. In this case, the price is likely going to climb even higher in the coming hours.

More:
https://fbs.com/analytics/articles/usd-jpy--bullish-hammer-4475
 
EUR/USD: "WINDOW" ACTED AS SUPPORT
13:29 18.10.2017

1508333017-ec1bf2bbfc6ba7684a1b7d126bd33747_1200x1200_q90v3.png


The price is consolidating, but bulls are likely going to test the 34 Moving Average in the short term. If a pullback from this line happens, we could have a decline towards the nearest support.

1508333017-5d9dcdc49db3d634f4dcb7a7c605cd6d_1200x1200_q90v3.png


The lower "Window" has acted as support, so we should keep an eye on the Moving Averages as an intraday target. These lines could be a departure point for just another decline.

More:
https://fbs.com/analytics/articles/eur-usd-window-acted-as-support-4476
 
EUR/USD: 1/8 MM LEVEL ACTED AS SUPPORT AGAIN
13:56 18.10.2017

1508334859-3a589d0356fd33bf377c8e41c6b695b3_1200x1200_q90v3.png


Wave [ii] may have been formed, so there's an opportunity to have an upward impulse in wave [iii]. Previously we had a zigzag in wave 4. The main intraday target is 6/8 MM Level.

1508334859-2bc6fa2ea346148c5be210486396a286_1200x1200_q90v3.png


1/8 MM Level acted as support one more time, so there's a developing bullish impulse, which could be wave (i). In this case, the price is likely going to test 3/8 MM Level in the coming hours.

More:
https://fbs.com/analytics/articles/eur-usd-1-8-mm-level-acted-as-support-again-4478
 
EUR/USD: EURO REACHED SSA AND KIJUN’S RESISTANCE
06:14 19.10.2017

Technical levels: support – 1.1770, 1.1730; resistance – 1.1825.

Trade recommendations:

Sell — 1.1790; SL — 1.1810; TP1 — 1.1730; TP2 – 1.1700
Reason: bearish Ichimoku Cloud, but horizontal Senkou Span A and B; a dead cross of Tenkan-sen and Kijun-sen with horizontal lines; the prices are returned to the Senkou Span A and Kijun’s resistance and may continue the downtrend.

1508393617-5974574d0f06c411e972e24d898d2405_1200x1200_q90v3.png


More:
https://fbs.com/analytics/articles/eur-usd-euro-reached-ssa-and-kijun’s-resistance-4493
 
GBP/USD: POUND IS UNDER SSA YET
06:15 19.10.2017

Technical levels: support – 1.3130; resistance – 1.3200, 1.3240.

Trade recommendations:

Sell — 1.3200; SL — 1.3220; TP1 — 1.3130; TP2 — 1.310.
Reason: expanding bearish Ichimoku Cloud with falling Senkou Span A; a new dead cross of Tenkan-sen and Kijun-sen, falling Tenkan-sen; the prices are growing up along Senkou Span A and reached the resistance of Tenkan-sen and Kijun-sen.

1508393618-5838ef800660551113de2aff99712827_1200x1200_q90v3.png


More:
https://fbs.com/analytics/articles/gbp-usd-pound-is-under-ssa-yet-4494
 
EUR/JPY: EURO SAYS “BYE” TO CONSOLIDATION
07:00 19.10.2017

Recommendation:

BUY 133.5

SL 132.95

TP1 135 TP2 136.1

On the daily chart, EUR/JPY is consolidating in the 131.65-133.50 range within the “Spike and ledge” pattern. The trend is bullish, so it’s necessary to prefer buying. A break of resistance at 133.50 will increase the risks of triggering junior and senior AB=CD pattern.

1508396233-55c04992e33beb6c7445177b7291ecdd_1200x1200_q90v3.jpg


On H1, EUR/JPY formed a widening wedge. The pair’s return to 78.6-88.6% of the wave 4-5 points at bulls’ strength. To continue the rally a successful test of resistance at 133.50 is necessary.

1508396270-9f67e113001dbbd3768d5eb457a80a5d_1200x1200_q90v3.jpg


More:
https://fbs.com/analytics/articles/eur-jpy-euro-says-bye”-to-consolidation-4495
 
USD/JPY: BULLS HAVE AWAKENED
07:08 19.10.2017

Recommendation:

BUY 113.25

SL 112.7

TP1 114.3 TP2 115.35

On the daily chart, the inability of bulls to hold quotes within the long-term channel points at their weakness. Bulls counterattacked and want to reach 88.6% and 113% of the inverted “Shark” pattern.

1508396817-ffeeaa3a296d42fdfb7ac833309e861a_1200x1200_q90v3.jpg


On H1, USD/JPY formed a “Widening wedge”. A break of 78.6% of the wave 4-5 means that bulls are serious. A successful test of resistance at 113.25 will become a signal for opening longs.

1508396834-5a58341430f902d5cf350c6ff0d26acb_1200x1200_q90v3.jpg


More:
https://fbs.com/analytics/articles/usd-jpy-bulls-have-awakened-4496
 
Top