• The Forex, Binary Options Forum - welcomes you to our Community!

    DigitalCashPalace Forum is dedicated to discussions about Forex, Binary Options, commodities, stocks related.

    Please take a look around, and feel free to .

Market analysis and trade recommendations by FBS

GBP/USD: BROKEN BULLISH "PENNANT"
07:16 12.10.2017

1507792345-c771907dcf87ad4f3f4be2bbc7d2fea4_1200x1200_q90v3.png


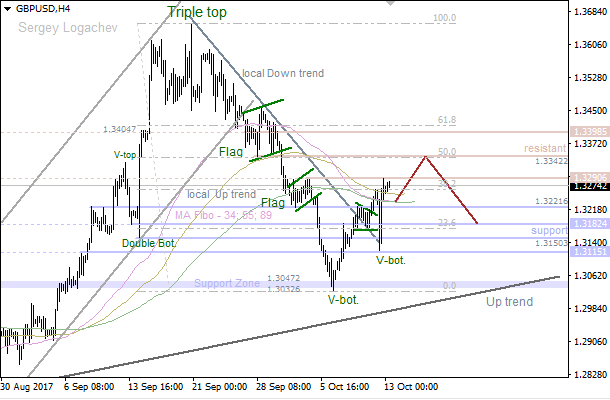
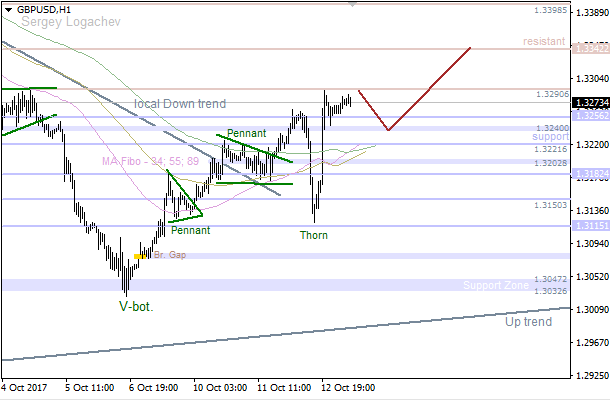
We've got a bullish "Pennant", which has been broken, so the price is still rising. It seems like the pair is ready to test the next resistance at 1.3290 - 1.3342. However, if we see a pullback from this area, there'll be an opportunity to have a decline in the direction of another support at 1.3221 - 1.3182.

1507792345-fdb08e12060327b0790482a76eedaaae_1200x1200_q90v3.png


The price faced with resistance at 1.3256, so there's a local consolidation. The 89 Moving Average is likely going to act as support during the day. If so, bulls will probably try to deliver a new local high afterwards.

More:
https://fbs.com/analytics/articles/gbp-usd-broken-bullish-pennant-4344
 
EUR/USD: WAVE [II] COMING SOON
07:20 12.10.2017

1507792760-c38be44bd287c8b4be215a6636aadb9b_1200x1200_q90v3.png


The price has been rising since a pullback from 0/8 MM Level happened. Wave is about to end, so if 3/8 MM Level acts as resistance, we could have a downward correction. In this case, we should keep an eye on 1/8 MM Level as an intraday bearish target.

1507792760-0255b7fffbbbd0786809d3949546e247_1200x1200_q90v3.png


There's a developing bullish impulse in wave , which is likely going to end soon. Therefore, if a pullback from 6/8 MM Level happens in the coming hours, bears will probably try to test 2/8 MM Level afterwards.

More:
https://fbs.com/analytics/articles/eur-usd-wave-ii-coming-soon-4346
 
USD/JPY: BEARISH "HARAMI"
11:53 12.10.2017

1507809144-e8f92659269bb7a8819f6dac1be7180c_1200x1200_q90v3.png


The 55 Moving Average has acted as support. However, there's also resistance by the upper "Window". In this case, the price is likely going to test the 89 MA. If a pullback from this line happens, we could have another bullish rally.

1507809144-98fed794a1299fa91ef56689bdd4e034_1200x1200_q90v3.png


There's a bearish "Harami", which has been formed at the last local high. This pattern has been confirmed afterwards, so the price is likely going to test the nearest support level during the day.

More:
https://fbs.com/analytics/articles/usd-jpy-bearish-harami-4351
 
EUR/USD: "ENGULFING" ON THE UPPER "WINDOW"
11:55 12.10.2017

1507809144-b3f25de5e9d953ea8ccccca872e7981e_1200x1200_q90v3.png


There's a bearish "Engulfing" pattern, which hasn't been confirmed yet. In this case, the market is likely going to test the 34 Moving Average, which could be a departure point for another upward price movement.

1507809144-d4ecc23f418f4f66481eefb1e8adf137_1200x1200_q90v3.png


We've got an "Engulfing", which has been formed on the upper "Window". Therefore, the pair is likely going to decline in the short term. The main bearish target is the 144 Moving Average.

More:
https://fbs.com/analytics/articles/eur-usd-engulfing-on-the-upper-window-4352
 
EUR/USD: NO ONE WANTS TO GIVE IN
07:01 13.10.2017

Recommendations:

SELL 1.193 SL 1.1985 TP 1.177

BUY 1.177 SL 1.1705 TP 1.193

On the daily chart, the “Shark” pattern is transforming into 5-0. Pullbacks towards 38.2%, 50% and 61.8% of the wave CD are usually used for selling. The inability of bulls to lead the pair outside of the downtrend channel will point at their weakness.

1507878025-8afba167b3e7c15d0d5d28d0f3c7b966_1200x1200_q90v3.png


On H1, EUR/USD keeps forming the “Widening wedge”. Pullbacks towards 23.6%, 38.2% and 50% of the wave 4-5 are usually used for buying. Long positions can be entered at 1.1715 and 1.1695.

1507878039-144c086f9efd0dd7367f2818eb875c0e_1200x1200_q90v3.png


More:
https://fbs.com/analytics/articles/eur-usd-no-one-wants-to-give-in-4366
 
EUR/GBP DOESN’T WANT TO GIVE UP
07:28 13.10.2017

Recommendation:

BUY 0.8855 SL 0.88 TP1 0.8955 TP2 0.9055

BUY 0.902 SL 0.8965 TP1 0.91 TP2 0.92

On the daily chart, the “Shark” pattern is transforming into 5-0. Pullbacks towards 38.2%, 50% and 61.8% of the wave CD are usually used for buying.

1507879638-bc1ce4ebdd72b71af2881b8edc2b5fe5_1200x1200_q90v3.png


On H1, a break below support at 0.8905-0.8915 will trigger the senior “Shark” pattern with targets at 61.8%, 78.6%, and 88.6%. Risks of the uptrend’s resumption will strengthen in case of a successful test of resistance at 0.9020 (88.6% of the wave CD of the junior “Shark” pattern).

1507879656-311438cdc50bb0f634d8ee27e47a0113_1200x1200_q90v3.png


More:
https://fbs.com/analytics/articles/eur-gbp-doesn’t-want-to-give-up-4368
 
GBP/USD: POUND IS GOING TO SSB
07:37 13.10.2017

Technical levels: support – 1.3270; resistance – 1.3340.

Trade recommendations:

Sell — 1.3340; SL — 1.3360; TP1 — 1.3270; TP2 — 1.3240.
Reason: narrowing bearish Ichimoku Cloud, rising Senkou Span B; a golden cross of Tenkan-sen and Kijun-sen with rising Tenkan-sen and Kijun-sen; the prices are going to Senkou Span B after supported by Kijun-sen.

1507880223-5838ef800660551113de2aff99712827_1200x1200_q90v3.png


MoreL:
https://fbs.com/analytics/articles/gbp-usd-pound-is-going-to-ssb-4369
 
AUD/USD: AUSSIE ENTERED INTO CLOUD
07:38 13.10.2017

Technical levels: support – 0.7800; resistance – 0.7850, 0.7880.

Trade recommendations:

Sell — 0.7850; SL — 0.7870; TP1 — 0.7800; TP2 — 0.7780.
Reason: bearish Ichimoku Cloud with rising Senkou Span A; a golden cross of Tenkan-sen and Kijun-sen with rising Tenkan-sen; the prices are entered into the Cloud and will test the highs of a last week.

1507880223-42a68b4bfa2f0515dfbaa054e9dbae66_1200x1200_q90v3.png


More:
https://fbs.com/analytics/articles/aud-usd-aussie-entered-into-cloud-4370
 
EUR/USD: 34 MA ACTED AS SUPPORT
08:08 13.10.2017

1507882028-321d858d61e125903ee11bf960e6035b_1200x1200_q90v3.png


The price is consolidating between the levels 1.1892 - 1.1822. It's likely that bulls are going to reach the nearest resistance at 1.1892 in the short term. If a pullback from this level happens little later on, there'll be an opportunity to have a decline towards the closest support at 1.1822 - 1.1793.

1507882028-076e62ecec93eb570bba973a268d6685_1200x1200_q90v3.png


The 34 Moving Average has acted as support, so the price is consolidating. In this case, bears are likely going to test the 55 Moving Average soon. However, if we have a pullback from this line, bulls will probably try to reach another resistance at 1.1879 - 1.1889.

More:
https://fbs.com/analytics/articles/eur-usd-34-ma-acted-as-support-4371
 
GBP/USD: "THORN" PATTERN
08:09 13.10.2017

1507882028-e0a35a68c5463919245166309dc44607_1200x1200_q90v3.png


Bulls faced with resistance at 1.3290, but the market is likely going to continue moving up, so we should keep an eye on the next resistance at 1.3290 - 1.3342 as an intraday target. If we have a pullback from this area, there'll be an opportunity to have a decline towards the nearest support at 1.3221 - 1.3182.

1507882027-782a2d2fad77dd5db39efcdd29062dc8_1200x1200_q90v3.png


We've got a "Thorn" pattern, so the price is consolidating. Therefore, the market is likely going to reach the nearest support at 1.3256 - 1.3221 during the day. At the same time, if we have a pullback from these levels, bulls will probably try to test the next resistance at 1.3290 - 1.3343.

More:
https://fbs.com/analytics/articles/gbp-usd-thorn-pattern-4372
 
EUR/USD: BULLS GOING TO DELIVER WAVE [III]
10:26 13.10.2017

1507890323-d6ff00347a7d6f1f0340a6623f409f2b_1200x1200_q90v3.png


There's a zigzag in wave 4, so an upward impulse in wave has been formed. In this case, we could have a correction, which could be wave [ii]. Nevertheless, bulls are likely going to deliver wave [iii] afterwards.

1507890323-6e21e226f50228a64fc3792a21ddec69_1200x1200_q90v3.png


Wave (v) of may have been ended, cause there's a pullback from 5/8 MM Level. Wave [ii] is likely going to take the form of a zigzag, so we should keep an eye on 2/8 MM Level, which could be a departure point for wave (i) of [iii].

More:
https://fbs.com/analytics/articles/eur-usd-bulls-going-to-deliver-wave-iii-4375
 
NZD/USD: BEARS ARE IN THE FORTRESS
07:05 16.10.2017

Recommendation: SELL 0.7145 SL 0.72 TP 0.698

On the daily chart, NZD/USD formed AB=CD pattern with a target at 127.2%. The pair failed to reach 78.6% of the Gartley pattern. This gives bears hope for a resumption of the downtrend. Their main task is not to let bears get above 0.7190 and 0.7780.

1508137466-fb9be1d9d65d6402746f6573306cf53b_1200x1200_q90v3.png


On H1, further dynamics of the pair will depend on bears’ ability to return the pair below support at 0.7145. If they manage to do this, chances for a resumption of the downtrend will increase.

1508137486-3696dc2326705fd45dfa7b732beb8b1e_1200x1200_q90v3.png


More:
https://fbs.com/analytics/articles/nzd-usd-bears-are-in-the-fortress-4403
 
AUD/USD: AUSSIE GOING TO SSB
07:47 16.10.2017

Technical levels: support – 0.7860; resistance – 0.7915, 0.7955

Trade recommendations:

Buy — 0.7880; SL — 0.7860; TP1 — 0.7915; TP2 — 0.7955.
Reason: narrowing bearish Ichimoku Cloud, rising Senkou Span A; a golden cross of Tenkan-sen and Kijun-sen, rising Tenkan-sen and Kijun-sen; the prices are on the strong support, but the market is overbought.

1508140047-42a68b4bfa2f0515dfbaa054e9dbae66_1200x1200_q90v3.png


More:
https://fbs.com/analytics/articles/aud-usd-aussie-going-to-ssb-4404
 
USD/JPY: DOLLAR WILL TEST SSB’S SUPPORT
07:49 16.10.2017

Technical levels: support – 111.50; resistance – 112.40.

Trade recommendations:

Buy — 111.50; SL — 111.30; TP1 — 112.40; TP2 — 112.80.
Reason: narrow bearish Ichimoku Cloud with falling Senkou Span A; a dead cross of Tenkan-sen and Kijun-sen with horizontal Tenkan-sen; the prices are falling down to the support of lower border of the Cloud.

1508140047-3dcc4d3b0e9d38341d309e86e7227f36_1200x1200_q90v3.png


More:
https://fbs.com/analytics/articles/usd-jpy-dollar-will-test-ssb’s-support-4405
 
AUD/USD: BULLS COUNTERATTACKED
08:41 16.10.2017

Recommendations:

BUY 0.7815 SL 0.776 TP1 0.7955 TP2 0.8055

SELL 0.775 SL 0.7805 TP 0.7615

On the daily chart, the inability of bears to pull the prices below 0?7727 pointed at their weakness. Bulls counterattacked and count on the inverted “Shark” pattern. To begin with, they need to hold above 0.7872.

1508143220-1db64c049cc9775b27418fd0e6b0833a_1200x1200_q90v3.png


On H1, AUD/USD formed a “widening wedge”. Pullbacks towards 23.6%, 38.2% and 50% of the wave 4-5 are usually used for buying. A decline below support levels at 78.6% and 88.6% may represent good selling opportunities.

1508143254-ef00342837a633bda01cab6a3fe3e88f_1200x1200_q90v3.png


More:
https://fbs.com/analytics/articles/aud-usd-bulls-counterattacked-4408
 
EUR/USD: BULLISH "HAMMER"
14:08 16.10.2017

1508162826-d75037310e801ff342755a78df682267_1200x1200_q90v3.png


The price reached the nearest support, so we could have a reversal bullish pattern soon. If so, the price is likely going to test the closes resistance level, which could be a departure point for another decline.

1508162827-e95d4040711e3663fa83b062fa572b81_1200x1200_q90v3.png


We've got a bullish "Harami" at the local low. Considering confirmation of this pattern, the market is likely going to test the next resistance level during the day. If any bearish pattern arrives little later on, we'll likely have just another decline.

More:
https://fbs.com/analytics/articles/eur-usd-bullish-hammer-4421
 
USD/JPY: BULLISH "HAMMER"
15:33 16.10.2017

1508162827-ecba764ae555bda4cd4831d1a95a5750_1200x1200_q90v3.png


The 89 Moving Average is acting as support, so we've got a bullish "Hammer" on this line. Therefore, the pair is likely going to test the 34 MA, which could act as resistance.

1508162827-0745a9342df788e05d8395a757e466b0_1200x1200_q90v3.png


There's a bullish "Hammer", so the market is likely going to test the Moving Averages in the coming hours. If a pullback from these lines happens, there'll be an opportunity to have a new local low.

More:
https://fbs.com/analytics/articles/usd-jpy-bullish-hammer-4422
 
EUR/USD: WAVE [II] ENDED LIKE A ZIGZAG
15:43 16.10.2017

1508168533-1633536f92d35167565bb64d2ea70130_1200x1200_q90v3.png


There's a pullback from 1/8 MM Level, so wave [ii] may have been formed. So, we're likely going to have another upward price movement. The main target for wave [iii] is 6/8 MM Level.

1508168533-94e3d1298503605ba5df03576c95c4ff_1200x1200_q90v3.png


Wave [ii] ended like a zigzag, so the price is rising. 2/8 MM Level has acted as support. In this case, we could have wave (i) in the coming hours and wave (ii) little later on.

More:
https://fbs.com/analytics/articles/eur-usd-wave-ii-ended-like-a-zigzag-4423
 
EUR/USD: EURO RETURNED TO SENKOU SPAN A
06:02 17.10.2017

Technical levels: support – 1.1770, 1.1730; resistance – 1.1825.

Trade recommendations:

Buy — 1.1730; SL — 1.1710; TP1 — 1.1800; TP2 – 1.1825
Reason: bearish Ichimoku Cloud wit falling Senkou Span A; a new weak dead cross of Tenkan-sen and Kijun-sen with horizontal lines; the prices are breakdown the Kijun’s support and going to bottom border of a Cloud.

1508220072-5974574d0f06c411e972e24d898d2405_1200x1200_q90v3.png


More:
https://fbs.com/analytics/articles/eur-usd-euro-returned-to-senkou-span-a-4434
 
GBP/USD: POUND SUPPORTED BY KIJUN-SEN
06:03 17.10.2017

Technical levels: support – 1.3230; resistance – 1.3340.

Trade recommendations:

Buy — 1.3230; SL — 1.3210; TP1 — 1.3340; TP2 — 1.3375.
Reason: bearish Ichimoku Cloud with horizontal Senkou Span A and B; a new golden cross of Tenkan-sen and Kijun-sen, but the lines are horizontal; the prices are returned to Kijun-sen in a correctional movement.

1508220072-5838ef800660551113de2aff99712827_1200x1200_q90v3.png


More:
https://fbs.com/analytics/articles/gbp-usd-pound-supported-by-kijun-sen-4435
 
Top