• The Forex, Binary Options Forum - welcomes you to our Community!

    DigitalCashPalace Forum is dedicated to discussions about Forex, Binary Options, commodities, stocks related.

    Please take a look around, and feel free to .

Market analysis and trade recommendations by FBS

EUR/USD Daily Analytics
14:03 07.11.2017

1510063297-648abc9cfdea63ca06158e95c590200c_1200x1200_q90v3.png


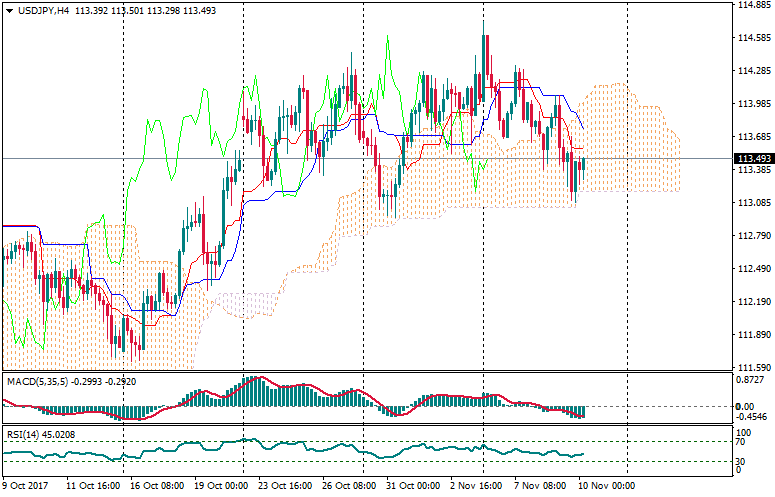
The last "Shooting Star" led to the current decline. Also, there isn't any reversal pattern so far. If the 21 Moving Average acts as resistance, we're likely going to have just another decline.

1510063297-dd373282864199e4f2da4a7cb5e2d098_1200x1200_q90v3.png


We don't have any reversal pattern for now. Yesterday, we had a "Tweezers" pattern, so there's a new local low. In this case, the pair is likely going to test the nearest support area during the day.

More:
https://fbs.com/analytics/articles/eur-usd-shooting-star-led-to-decline-4928
 
USD/JPY Daily Analytics
14:05 07.11.2017

1510063297-5b9dd48e37d78622980d13021600b0a3_1200x1200_q90v3.png


There's a bullish "Engulfing", which has been formed on the 34 Moving Average. Considering confirmation of this pattern, the price is likely going to test the closest resistance area once again.

1510063297-df06835c130cab39721eccd13bfbc17b_1200x1200_q90v3.png


We've got a "High Wave" pattern on the local high, so the pair is likely going to test the 89 Moving Average. If a pullback from this line happens little later on, we could have another bullish price movement.

More:
https://fbs.com/analytics/articles/usd-jpy-high-wave-on-the-local-high-4929
 
EUR/USD Daily Analitycs
06:04 08.11.2017
Technical levels: support – 1.1550, 1.1580; resistance – 1.1620.

Trade recommendations:

Sell — 1.1620; SL — 1.1640; TP1 — 1.1580; TP2 – 1.1550
Reason: expanding bearish Ichimoku Cloud, falling Senkou Span A; a new dead cross of Tenkan-sen and Kijun-sen with falling Tenkan-sen; the prices are formed new local lows, but needs a correction to Tenkan or Kijun.

1510121059-5974574d0f06c411e972e24d898d2405_1200x1200_q90v3.png


More:
https://fbs.com/analytics/articles/eur-usd-euro-reached-new-lows-4941
 
USD/JPY Daily Analitycs
06:05 08.11.2017
Technical levels: support – 113.70; resistance – 114.40.

Trade recommendations:

Buy — 114.00; SL — 113.80; TP1 — 114.40; TP2 — 114.80.
Sell — 113.60; SL — 113.80; TP1 — 113.00; TP2 — 112.40.
Reason: narrowing bullish Ichimoku Cloud with falling Senkou Span A; a new dead cross of Tenkan-sen and Kijun-sen; the bulls can’t breaking out a resistance of Tenkan-sen and Kijun-sen and the prices returned to Cloud.

1510121059-3dcc4d3b0e9d38341d309e86e7227f36_1200x1200_q90v3.png


More:
https://fbs.com/analytics/articles/usd-jpy-back-again-to-cloud-4942
 
USD/CHF Daily Analitycs
07:00 08.11.2017
Recommendation:

BUY 1.0035 SL 0.998 TP1 1.0145 TP2 1.0235

SELL 0.994 SL 0.9995 TP1 0.9875 TP2 0.984

On the daily chart, USD/CHF consolidated after reaching 224% target of AB=CD. A triangle was formed. A break of its upper border will allow bulls to continue rally towards 1.0145 and 1.0235.

1510124299-a5903a7f3cf43bc4f33886526fd841ba_1200x1200_q90v3.png


On H1, USD/CHF keeps forming a ledge within “Spike and ledge” pattern. A successful test of resistance at 1.0035 will open the way up to bulls. On the other hand, decline below support at 0.9940 will let bears develop correction.

1510124323-351a015a31e5fdb2fee97b43bc66aebc_1200x1200_q90v3.png


More:
https://fbs.com/analytics/articles/usd-chf-franc-got-to-the-top-4944
 
GBP/USD Daily Analitycs
07:18 08.11.2017
Recommendation:

SELL 1.3105

SL 1.3160 TP1 1.2890

TP2 1.2710

On the daily chart, GBP/USD is consolidating between 1.3045 and 1.3320. A break of its upper border will create grounds for the pound’s increase to 1.3415 and 1.3520. On the other hand, successful test of support at 1.3045 will increase the risks of the pair going to 200% target of AB=CD.

1510125455-b6b56ed02b1869ac79ae2067aff9ca74_1200x1200_q90v3.png


On H1, after forming “Wolfe waves” USD/CHF formed a “Widening wedge”. As usual, the pair’s advance above 88.6% of the wave 4-5 is used for buying, while the fall below 23.6% is used for selling.

1510125473-2cf183d9aa99dd882e50bd88c66a58cb_1200x1200_q90v3.png


More:
https://fbs.com/analytics/articles/gbp-usd-pound-is-making-wedges-4946
 
EUR/USD Daily |Analitycs
08:14 08.11.2017

1510128735-8d1df78766c01fc0c0ea2f568d7911f3_1200x1200_q90v3.png


The main local trend is still bearish. The last "Flag" pattern led to a new low. It's likely that the price is going to reach the next support at 1.1533 - 1.1494 in the short term. If a pullback from this area happens little later on, there'll be an opportunity to have a bullish correction.

1510128735-4ec1e8164dd97a97a7a42be11d33e0b6_1200x1200_q90v3.png


The 34 Moving Average has acted as resistance, so there's a "Double Top" pattern, which pushed the price to the closest support at 1.1582. The main intraday target is the next resistance at 1.1601 - 1.1605, which could be a departure point for another bearish price movement.

More:
https://fbs.com/analytics/articles/eur-usd-flag-pattern-led-to-new-low-4950
 
GBP/USD Daily Analitycs
08:17 08.11.2017

1510128734-4f396cdf10a4ad5036df9066b3f4060e_1200x1200_q90v3.png


The 34 Moving Average has acted as resistance twice, so the market is likely going to achieve the closest support at 1.3120 - 1.3081. If we see a pullback from these levels, bulls will probably try to reach another resistance at 1.3250 - 1.3239.

1510128734-e45c513bc296e6e0cfc38d2c3f91b553_1200x1200_q90v3.png


There are two "Double Top" patterns in a row, but the Moving Averages are acting as support, so we could have a new local high. If a pullback from the nearest resistance at 1.3177 - 1.3182 happens, bears are likely going to reach the next support area.

More:
https://fbs.com/analytics/articles/gbp-usd-two-double-top-patterns-in-a-row-4951
 
EUR/USD Daily Analitycs
11:35 08.11.2017

1510140565-837ce0b0dd1aa5a5e7ae9e6921c50100_1200x1200_q90v3.png


There're bullish patterns such a "Morning Star" and a "High Wave", which both have been confirmed. So, the 55 Moving Average is likely going to act as resistance. If so, we could have another decline afterwards.

1510140565-dca6a2b906ddd010b272ef393786867d_1200x1200_q90v3.png


We've got a "Shooting Star", which has been formed on the 55 Moving Average. However, confirmation of this pattern is a quite weak, so we could have a local bearish correction and the following decline littel later on.

More:
https://fbs.com/analytics/articles/eur-usd-shooting-star-4952
 
USD/JPY Daily Analitycs
11:38 08.11.2017

1510140565-59470c3a4d0a22ffec4edbf4498c44ae_1200x1200_q90v3.png


The last bearish "Harami" led to the current decline, but the Moving Averages are acting as support. Also, there isn't any reversal pattern so far, which means the price is likely going to continue declining until any bullish pattern forms.

1510140565-9e82d6d12096ff71df317a8ee11a08df_1200x1200_q90v3.png


The 89 Moving Average has acted as resistance, so we've got a bearish "High Wave" pattern. In this case, the last low is likely going to be broken soon. If any reversal pattern arrives afterwards, we could have a bullish correction towards the nearest resistance.

More:
https://fbs.com/analytics/articles/usd-jpy-bearish-high-wave-pattern-4953
 
EUR/USD Daily Analitycs
05:58 09.11.2017

Technical levels: support – 1.1550, 1.1580; resistance – 1.1620, 1.1640.

Trade recommendations:

Sell — 1.1620; SL — 1.1640; TP1 — 1.1580; TP2 – 1.1550
Reason: expanding bearish Ichimoku Cloud, falling Senkou Span A; a dead cross of Tenkan-sen and Kijun-sen with falling Tenkan-sen; the prices are fixed inside a channel of Tenkan-Kijun and may go to the bottom border of a Cloud.

1510207086-5974574d0f06c411e972e24d898d2405_1200x1200_q90v3.png


More:
https://fbs.com/analytics/articles/eur-usd-bulls-can-return-to-cloud-4972
 
GBP/USD Daily Analitycs
05:59 09.11.2017
Technical levels: support – 1.3080; resistance – 1.3130, 1.3180.

Trade recommendations:

Sell — 1.3130; SL — 1.3150; TP1 — 1.3080; TP2 — 1.3010.
Reason: expanding bearish Ichimoku Cloud, falling Senkou Span A; an irregular golden cross of Tenkan-sen and Kijun-sen; the market returned to Tenkan-sen in a local correction movement.

1510207086-5838ef800660551113de2aff99712827_1200x1200_q90v3.png


More:
https://fbs.com/analytics/articles/gbp-usd-bears-got-strength-4973
 
EUR/JPY Daily Analitycs
06:45 09.11.2017

Recommendation:

BUY 132.40

SL 131.85

TP1 133.3 TP2 134.15

On the daily chart, EUR/JPY formed “Wolfe waves” and a pin bar. Their formation will increase the odds of the uptrend resumption. If bulls manage to return inside the uptrend channel, risks of advance to 224% and 161.8% targets of senior and junior AB=CD patterns will significantly increase.

1510209858-8afba167b3e7c15d0d5d28d0f3c7b966_1200x1200_q90v3.png


On H1, a break of the diagonal resistance at 2-4 within the “Wolfe waves” pattern will become a signal for opening long positions towards 113% target of the “Shark” pattern.

1510209879-144c086f9efd0dd7367f2818eb875c0e_1200x1200_q90v3.png


More:
https://fbs.com/analytics/articles/eur-jpy-bulls-will-surf-4974
 
USD/JPY Daily Analitycs
06:58 09.11.2017

Recommendation:

BUY 114.3

SL 113.75

TP1 115.3 TP2 116.25

On the daily chart, USD/JPY will continue forming the “Shark” pattern with the target at 113%. Rebound of the quotes from the lower border of the upside trend channel with the following formation of the pin bar means that bulls are seizing back the initiative.

1510210642-3297c54597baddc0779dab87f73568a2_1200x1200_q90v3.png


On H1, a break above of the neckline of “Head and shoulders” pattern points at unsuccessful retest. This strengthens the risks of the pair’s advance. Its return to resistance at 114.30 with the following increase above this level will allow bulls to continue the rally.

1510210656-1f50b4d918123f905c31c70a9dfda50a_1200x1200_q90v3.png


More:
https://fbs.com/analytics/articles/usd-jpy-bulls-left-the-stall-4976
 
EUR/USD Daily Analitycs
08:59 09.11.2017

1510217892-62a1a429cfa610f25a481c6f2dad8a9a_1200x1200_q90v3.png


There's a new local low, but bears faced with support at 1.1560, so we've got a "V-Bottom", which pushed the price higher. In this case, the pair is likely going to reach the nearest resistance at 1.1615 - 1.1634 in the short term. If a pullback from this area happens, there'll be an opportunity to have another decline.

1510217892-13f2d7cac3c9ef017342bcbe76b44e9d_1200x1200_q90v3.png


We've got a bullish "Pennant" on the one-hour chart, so the market is likely going to test the closest resistance at 1.1634 during the day. If a pullback from this level happens little later on, bears will probably try to deliver a downward price movement in the direction of the next support at 1.1560 - 1.1553.

More:
https://fbs.com/analytics/articles/eur-usd-bullish-pennant-4981
 
GBP/USD Daily Analitycs
09:04 09.11.2017

1510217892-b23792d52c4950d54bef3367f1b17372_1200x1200_q90v3.png


There's a "V-Bottom" pattern, which has been confirmed, so the pair is likely going to test the 55 Moving Average soon. If we have a pullback from this line, bears will probably try to start another decline towards the last low.

1510217892-df01c802e1b1d99273a97138663d6ce0_1200x1200_q90v3.png


Bulls have broken the last "Pennant" pattern, so the price is rising. However, if a pullback from the nearest resistance at 1.3177 - 1.3182 happens afterwards, we could have a decline in the direction of the next support area.

More:
https://fbs.com/analytics/articles/gbp-usd-confirmed-v-bottom-pattern-4982
 
EUR/USD Daily Analytics
14:03 09.11.2017

1510236152-49bc75afccf00ddd26b0fbb9303f8da3_1200x1200_q90v3.png


The price reached the 34 Moving Average, but there isn't any reversal pattern so far. In this case, bulls are likely going to test the 89 MA in the short term. If a pullback from this line happens, we could have just another decline.

1510236153-991b9893f553ad0e8b0694a5b52a3ee6_1200x1200_q90v3.png


The last "Three Methods" pattern has acted as support. At the same time, we don't have any bearish candle pattern for now. In this case, the upward correction is likely going to move on until any reversal pattern forms.

More:
https://fbs.com/analytics/articles/eur-usd-price-reached-the-34-ma-4984
 
USD/JPY Daily Analytics
14:05 09.11.2017

1510236153-90b7a989e98a7a2469ccc95089a861c7_1200x1200_q90v3.png


There isn't any reversal pattern, so the price is still declining. Therefore, the market is likely going to continue moving down until any bullish candle pattern arrives.

1510236153-facfd88c0e4e8b6d62b0d5645ddde104_1200x1200_q90v3.png


The last "Tweezers" pattern pushed the price lower. All the last candles are black, so we could see the pair even lower in the coming hours. The main intraday target is the lower "Window", which could be a departure point for an upward correction.

More:
https://fbs.com/analytics/articles/usd-jpy-tweezers-pattern-4985
 
AUD/USD Daily Anlytics
06:04 10.11.2017
Technical levels: support – 0.7640; resistance – 0.7690

Trade recommendations:

Buy — 0.7700; SL — 0.7680; TP1 — 0.7760.
Sell — 0.7670; SL — 0.7690; TP1 — 0.7590; TP2 — 0.7540.
Reason: bearish Ichimoku Cloud with rising Senkou Span A; a new golden cross of Tenkan-sen and Kijun-sen; the prices returned to bottom border of the Cloud and may enter into cloudy area.

1510293881-42a68b4bfa2f0515dfbaa054e9dbae66_1200x1200_q90v3.png


More:
https://fbs.com/analytics/articles/aud-usd-aussie-in-consolidation-under-cloud-4996
 
USD/JPY Daily Analytics
06:06 10.11.2017

Technical levels: support – 113.20; resistance – 113.80.

Trade recommendations:

Buy — 114.00; SL — 113.80; TP1 — 114.40; TP2 — 114.80.
Sell — 113.30; SL — 113.50; TP1 — 112.40; TP2 — 112.20.
Reason: narrowing bullish Ichimoku Cloud with falling Senkou Span A; a dead cross of Tenkan-sen and Kijun-sen; the prices are tested the support of Senkou Span B and staying inside a Cloud.

1510293881-3dcc4d3b0e9d38341d309e86e7227f36_1200x1200_q90v3.png


More:
https://fbs.com/analytics/articles/usd-jpy-dollar-testing-ssb’s-support-4997
 
Top