BTCUSD and XRPUSD Technical Analysis – 28th SEPT, 2021

BTCUSD: Grinding above $40K Support
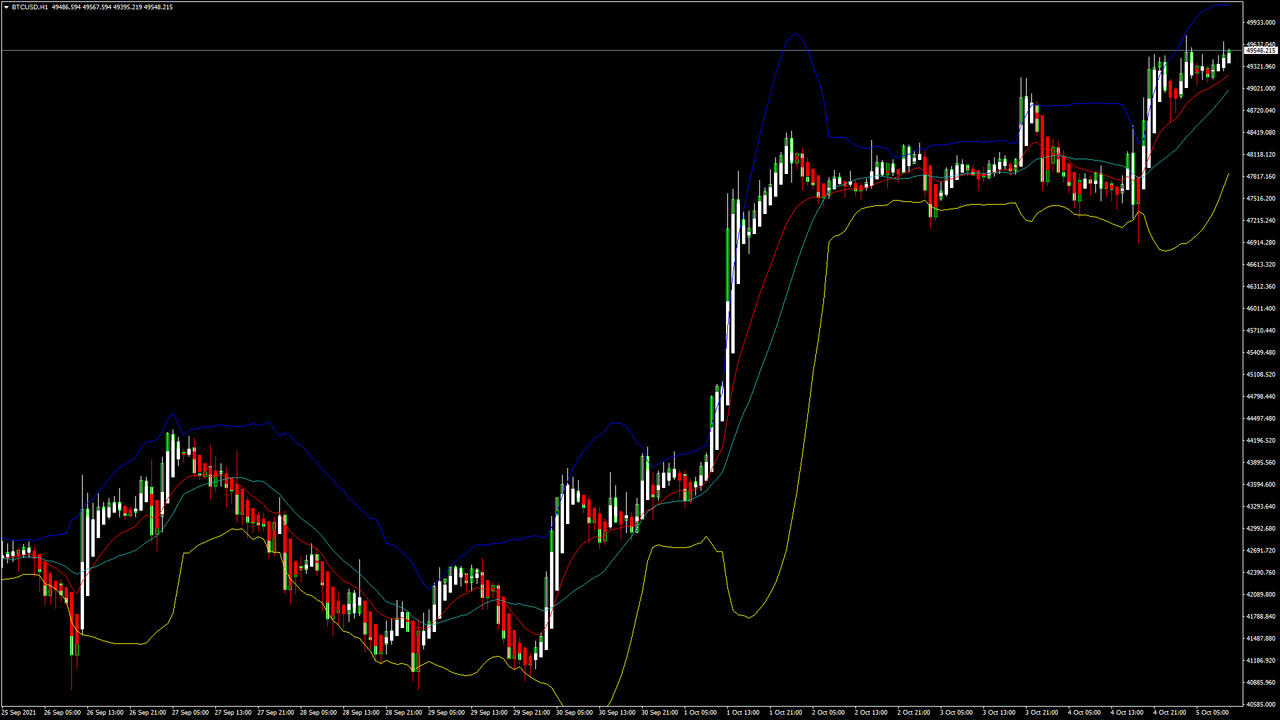
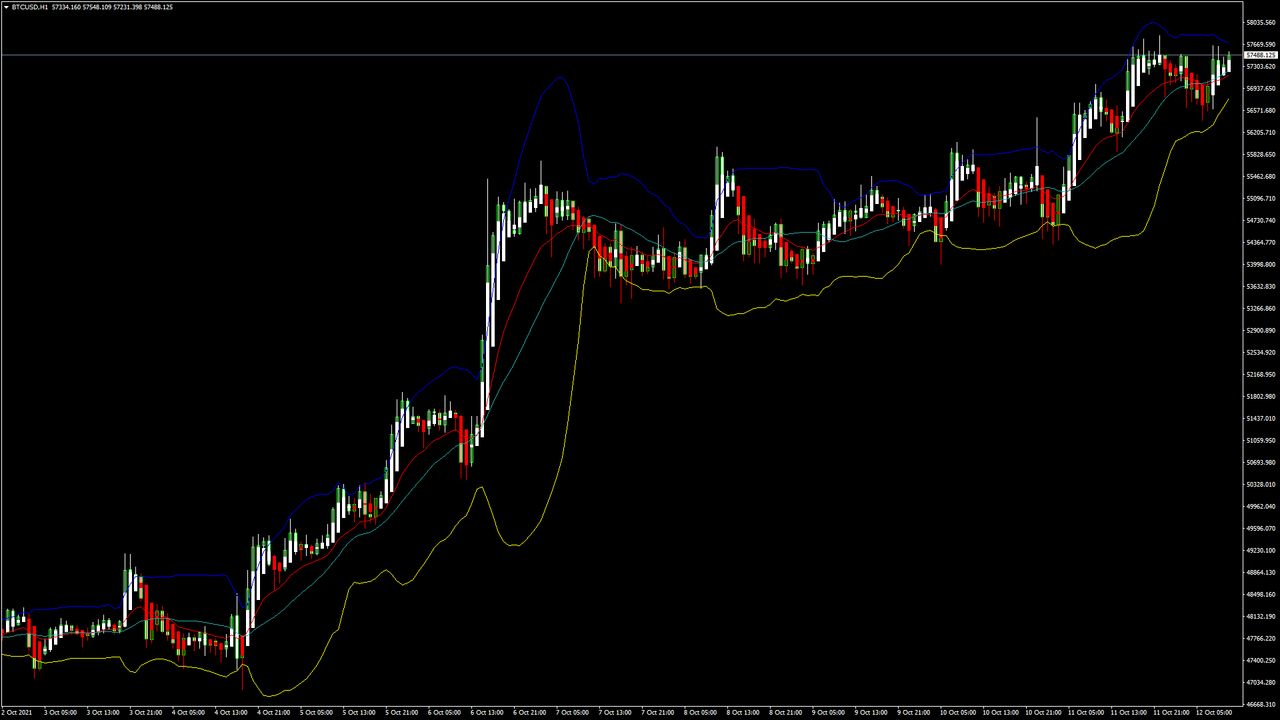
Bitcoin is currently struggling to keep itself above the $40k support and the price is oscillating between the Fibonacci levels of $41472 and 100-day moving average of $42834. It remains in accumulation mode in the London trading session. BTC bullish sentiment was seen at the opening of this week when it touched a high of $44304. Long-term outlook for bitcoin appears bullish and the short-term decline currently reinforces a mild bearish trend formation.
Bitcoin Short-Term Bearish Formations

Bitcoin saw a mixed start this week and there is no sign of a bullish momentum. The 100 day moving average is indicating a strong SELL.
The immediate targets would be breaching the classic support levels at $41243 and further moving towards the next major support located at $35819.
Bitcoin is witnessing increased volatility after China banned all crypto transactions during the previous weekly closing on Friday. The support that is holding this week could be broken and bitcoin could start a further decline this week pushing below the psychological support level of $40000.
In the last 24hrs, BTCUSD has dropped by -4.76% (+2087$) and has a 24hr trading volume of USD 31.47 billion.
Bitcoin Sell-Off Continues
Bitcoin is facing selling pressure after the China ban and the trading volumes are high at the Asian exchanges today.
Also, many crypto currency exchanges are closing their Chinese accounts, leading to a withdrawal of funds in the US dollars and putting a selling pressure on BTCUSD.
Technical Indicators:
Relative strength index (14-day): at 32.442 with a SELL
Ultimate oscillator: at 40.38 with a SELL
Moving averages convergence divergence (12,26): at -370.10 with a SELL
Price of rate change ROC: at -2.31 indicating a SELL
Read Full on FXOpen Company Blog...
BTCUSD: Grinding above $40K Support
Bitcoin is currently struggling to keep itself above the $40k support and the price is oscillating between the Fibonacci levels of $41472 and 100-day moving average of $42834. It remains in accumulation mode in the London trading session. BTC bullish sentiment was seen at the opening of this week when it touched a high of $44304. Long-term outlook for bitcoin appears bullish and the short-term decline currently reinforces a mild bearish trend formation.
- The relative strength index (14-day) and ultimate oscillator are both indicating a SELL at the current market levels of $41745.
- A short-term correction below $40000 is expected before the continuation of the bullish trend.
- Simple and exponential moving averages indicate a strong SELL.
- Average true range (14-day) indicates high volatility.
Bitcoin Short-Term Bearish Formations
Bitcoin saw a mixed start this week and there is no sign of a bullish momentum. The 100 day moving average is indicating a strong SELL.
The immediate targets would be breaching the classic support levels at $41243 and further moving towards the next major support located at $35819.
Bitcoin is witnessing increased volatility after China banned all crypto transactions during the previous weekly closing on Friday. The support that is holding this week could be broken and bitcoin could start a further decline this week pushing below the psychological support level of $40000.
In the last 24hrs, BTCUSD has dropped by -4.76% (+2087$) and has a 24hr trading volume of USD 31.47 billion.
Bitcoin Sell-Off Continues
Bitcoin is facing selling pressure after the China ban and the trading volumes are high at the Asian exchanges today.
Also, many crypto currency exchanges are closing their Chinese accounts, leading to a withdrawal of funds in the US dollars and putting a selling pressure on BTCUSD.
Technical Indicators:
Relative strength index (14-day): at 32.442 with a SELL
Ultimate oscillator: at 40.38 with a SELL
Moving averages convergence divergence (12,26): at -370.10 with a SELL
Price of rate change ROC: at -2.31 indicating a SELL
Read Full on FXOpen Company Blog...