GBP/USD Could Extend Losses, USD/CAD Breaks Key Support

GBP/USD is showing bearish signs below the 1.2150 resistance. USD/CAD traded below the 1.3400 support, which might now act as a resistance.
Important Takeaways for GBP/USD and USD/CAD
GBP/USD Technical Analysis
The British Pound started a fresh decline from well above 1.2400 against the US Dollar. The GBP/USD pair gained bearish momentum after there was a break below the 1.2250 support.
The pair even broke the 1.2150 support level and the 50 hourly simple moving average. The recent swing high was formed near 1.2193 on FXOpen before the price started another decline. There was a move below the 50% Fib retracement level of the upward move from the 1.1961 swing low to 1.2193 high.
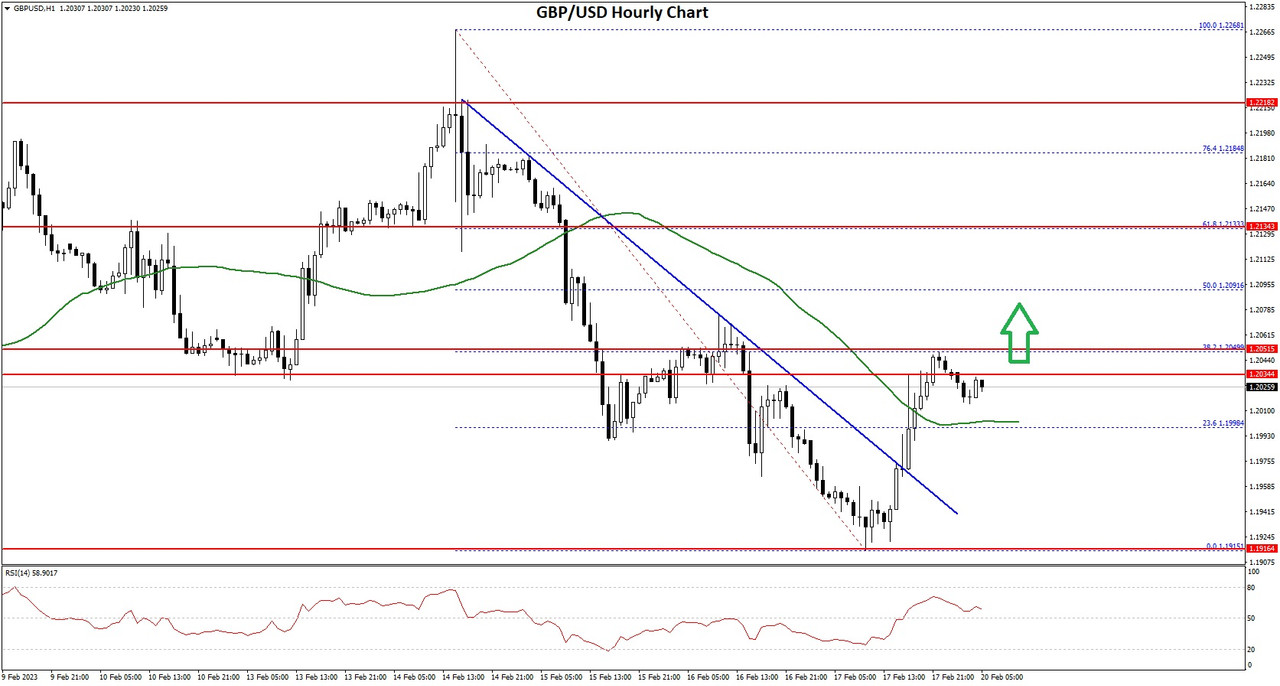
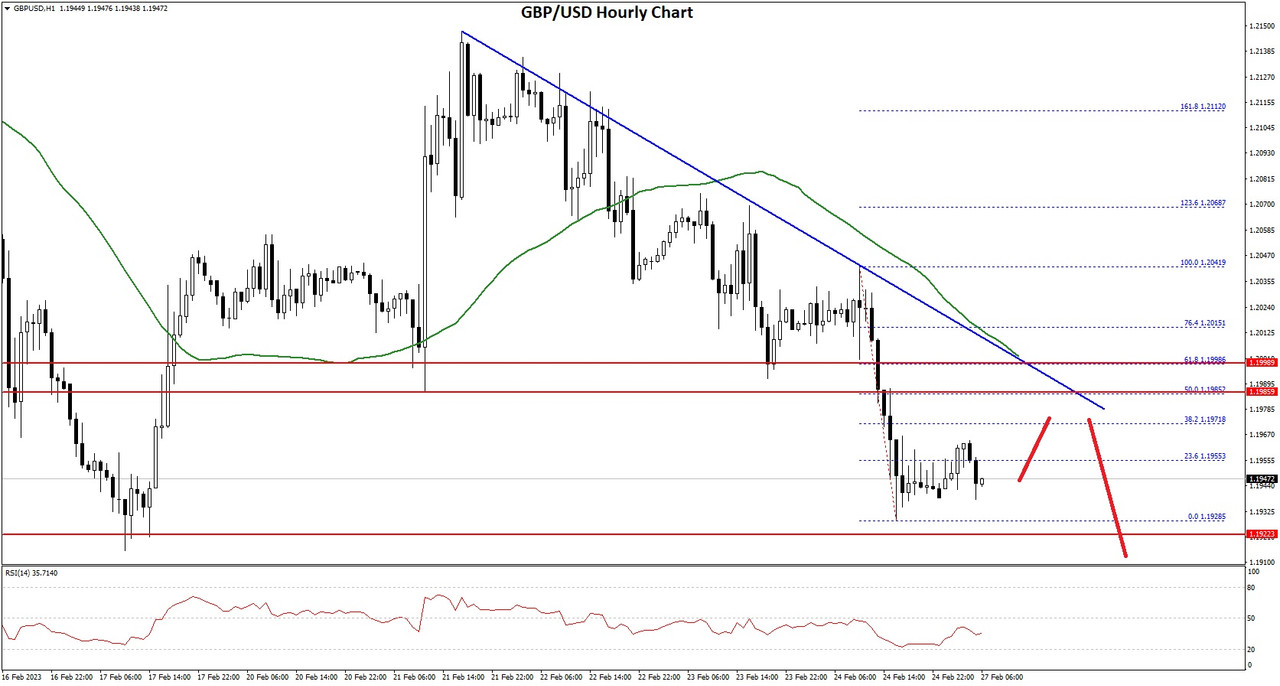
GBP/USD Hourly Chart
It is now trading below 1.2050 and the 50 hourly simple moving average. There is also a key bearish trend line forming with resistance near 1.2065 on the hourly chart of GBP/USD.
An immediate resistance is near the 1.2060 level. The next major resistance is near the 1.2100 level and the 50 hourly simple moving average. Any more gains could lead the pair towards the 1.2200 barrier in the near term.
If not, the pair could continue to move down and might even break the 1.2040 support. The next major support is near 1.2000 or the 76.4% Fib retracement level of the upward move from the 1.1961 swing low to 1.2193 high.
If there is a downside break, GBP/USD might test the 1.1960 support. The next major support sits at 1.1850, where the bulls might take a stand.
VIEW FULL ANALYSIS VISIT - FXOpen Blog...
Disclaimer: This Forecast represents FXOpen Companies opinion only, it should not be construed as an offer, invitation or recommendation in respect to FXOpen Companies products and services or as Financial Advice.
GBP/USD is showing bearish signs below the 1.2150 resistance. USD/CAD traded below the 1.3400 support, which might now act as a resistance.
Important Takeaways for GBP/USD and USD/CAD
- The British Pound started a fresh decline from the 1.2200 resistance zone.
- There is a key bearish trend line forming with resistance near 1.2065 on the hourly chart of GBP/USD.
- USD/CAD is struggling below the 1.3420 and 1.3400 support levels.
- There was a break below a connecting bullish trend line with support near 1.3380 on the hourly chart.
GBP/USD Technical Analysis
The British Pound started a fresh decline from well above 1.2400 against the US Dollar. The GBP/USD pair gained bearish momentum after there was a break below the 1.2250 support.
The pair even broke the 1.2150 support level and the 50 hourly simple moving average. The recent swing high was formed near 1.2193 on FXOpen before the price started another decline. There was a move below the 50% Fib retracement level of the upward move from the 1.1961 swing low to 1.2193 high.
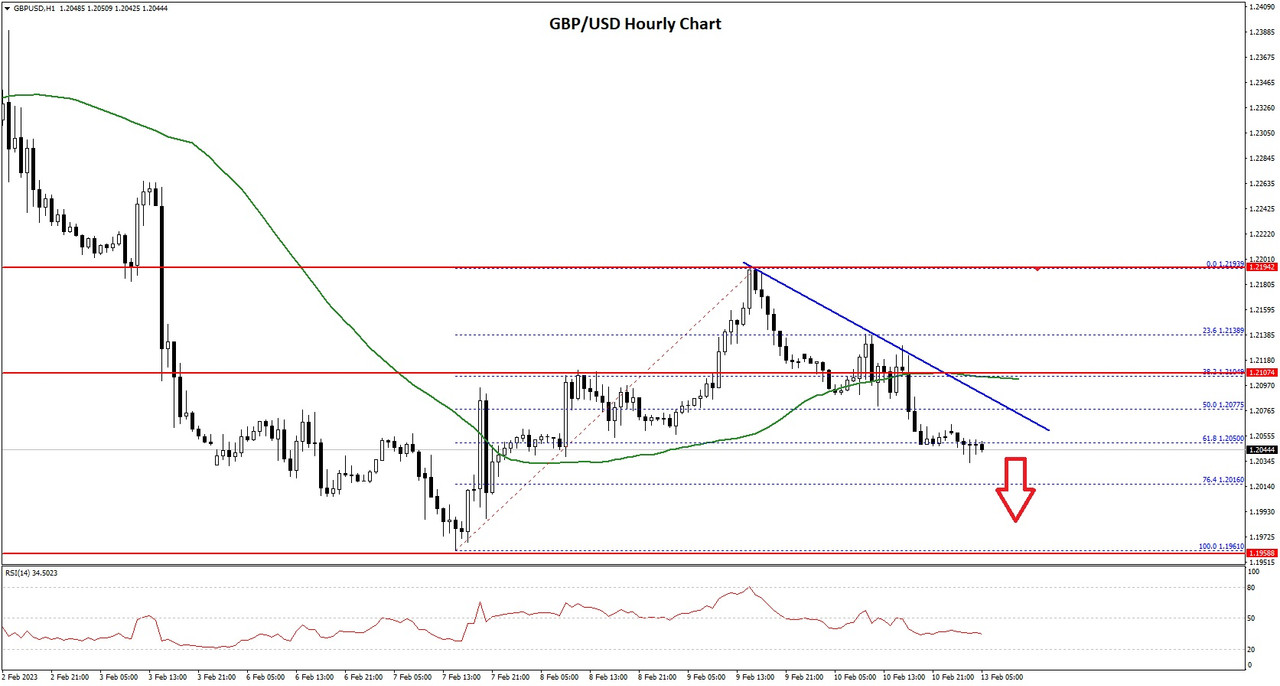
GBP/USD Hourly Chart
It is now trading below 1.2050 and the 50 hourly simple moving average. There is also a key bearish trend line forming with resistance near 1.2065 on the hourly chart of GBP/USD.
An immediate resistance is near the 1.2060 level. The next major resistance is near the 1.2100 level and the 50 hourly simple moving average. Any more gains could lead the pair towards the 1.2200 barrier in the near term.
If not, the pair could continue to move down and might even break the 1.2040 support. The next major support is near 1.2000 or the 76.4% Fib retracement level of the upward move from the 1.1961 swing low to 1.2193 high.
If there is a downside break, GBP/USD might test the 1.1960 support. The next major support sits at 1.1850, where the bulls might take a stand.
VIEW FULL ANALYSIS VISIT - FXOpen Blog...
Disclaimer: This Forecast represents FXOpen Companies opinion only, it should not be construed as an offer, invitation or recommendation in respect to FXOpen Companies products and services or as Financial Advice.