XAU/USD: gold is consolidating near 1900.00 again
Current trend
Gold prices are consolidating near 1900.00 in the morning session after a moderate increase the day before, which was supported by the weakness of USD. The US currency remains under significant pressure after last Friday's US labor market report for May reflected slower-than-expected growth in Nonfarm Payrolls.
This week, traders are awaiting the publication of data on the dynamics of consumer inflation in the US in order to try to put together the big picture and predict the course of monetary policy from the US Fed. It is likely that the American regulator will again maintain a wait-and-see attitude, saying that inflation is facilitated by the active period of economic recovery after the pandemic.
Support and resistance
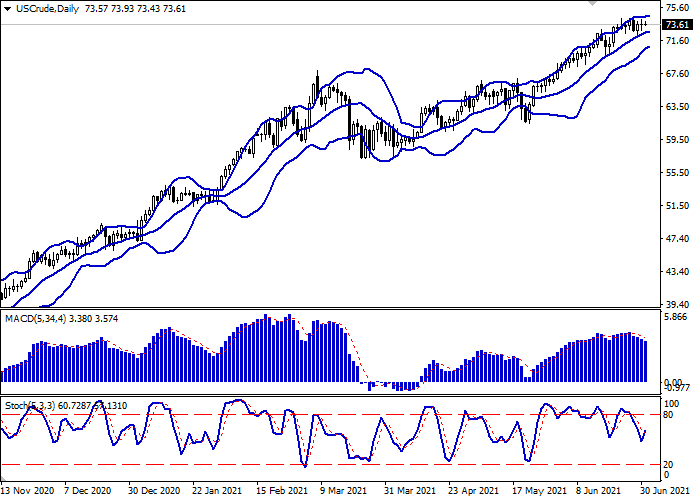
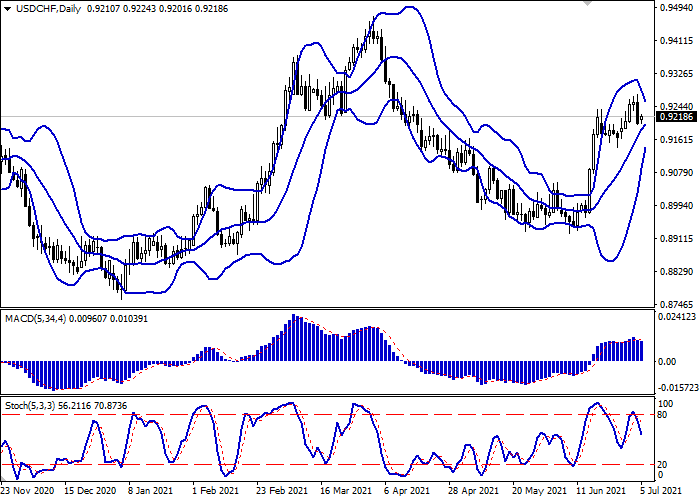
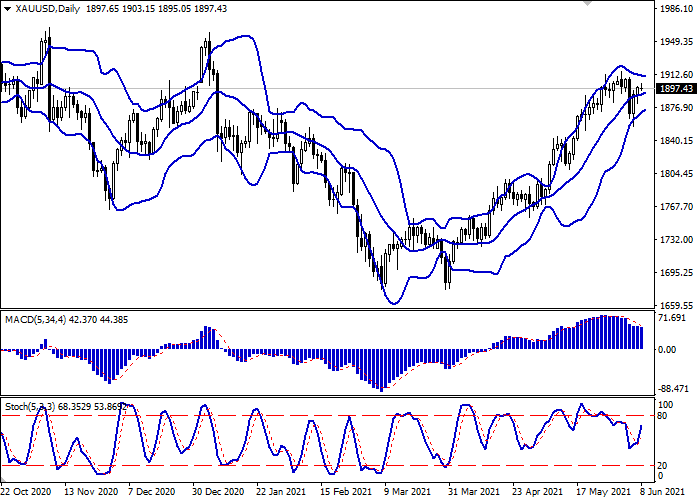
Bollinger Bands are showing insignificant growth on the daily chart. The price range is narrowing from below, indicating a multidirectional nature of trading in the short term. The MACD indicator is going down, maintaining a weak sell signal (the histogram is below the signal line). Stochastic, on the other hand, maintains a confident upward direction and is rapidly approaching its highs, which indicates the risks of an overbought instrument in the ultra-short term.
Existing long positions should be held until the signals from technical indicators are clarified.
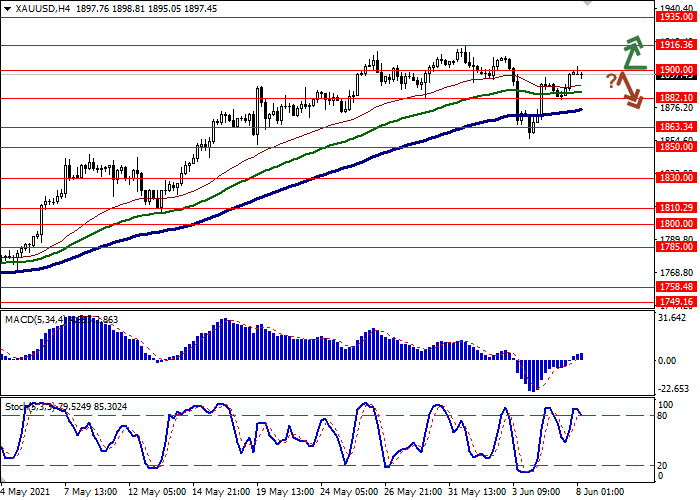
Resistance levels: 1900.00, 1916.36, 1935.00, 1952.53.
Support levels: 1882.10, 1863.34, 1850.00, 1830.00.


