• The Forex, Binary Options Forum - welcomes you to our Community!

    DigitalCashPalace Forum is dedicated to discussions about Forex, Binary Options, commodities, stocks related.

    Please take a look around, and feel free to .

Daily Technical Analysis by FxGrow

FxGrow Daily Technical Analysis – 28th June, 2017
By FxGrow Research & Analysis Team

GBP/USD Rallies Supported by Positive Fundamental, Awaiting Carney
GBPUSD_zpsblfq8xf4.png


After a disappointing UK Parliament Elections with sharp decline for GBP/USD, the pair found some positive fundamentals supporting Sterling sharp tone facing collapsing U.S Dollar. GBP/USD recorded +144-pips price action with 1.2860 high and closing at 1.2813, above 50-EMA (1.2777) which confirms a bullish momentum. Today, the cable plunged to 1.279 low after clocking 1.2827 high, currently trading at 1.2816 with expectations for more volatility taking into consideration sharp declines ...


For more in depth Research & Analysis please visit FxGrow.https://goo.gl/orcfae

Note: This analysis is intended to provide general information and does not constitute the provision of INVESTMENT ADVICE. Investors should, before acting on this information, consider the appropriateness of this information having regard to their personal objectives, financial situation or needs. We recommend investors obtain investment advice specific to their situation before making any financial investment decision.
 
FxGrow Daily Technical Analysis – 28th June, 2017
By FxGrow Research & Analysis Team

Crude Oil Technical Overview Ahead of U.S Inventories
crude_zpsgg4nnoog.png


Overall the market is bearish, but fighting to hold the 42.20- target. The trade posture remains negative and a drop through 42.53 is negative, rekindling bearish trade. A close under 42.20 alerts for a wash under 40.00-. Stay prepared for additional corrections, but rallies contained under 45.08* will retain bear forces. A close over 45.08* stops the selloff. A close over 4658* signals a ...

For more in depth Research & Analysis please visit FxGrow.https://goo.gl/goFmjk

Note: This analysis is intended to provide general information and does not constitute the provision of INVESTMENT ADVICE. Investors should, before acting on this information, consider the appropriateness of this information having regard to their personal objectives, financial situation or needs. We recommend investors obtain investment advice specific to their situation before making any financial investment decision.
 
FxGrow Daily Technical Analysis – 28th June, 2017
By FxGrow Research & Analysis Team

Gold Technical Overview Ahead of Central Banks Speeches
gold_zps41zs5yhi.png


Currently, gold favors sideways trading, stuck between 1240 & 1250 as the precious awaits further signals from U.S Index movements. Expectations for high volatility as ECB, BOE, BOC, and BOJ's Govs.address markerts today at 1:30 PM GMT. A more pressure on U.S Index will boost gold current advance. On the other hand, in case the buck managed to make a correction upward, expectations that gold will extend the ...

For more in depth Research & Analysis please visit FxGrow.https://goo.gl/iqH9ZN

Note: This analysis is intended to provide general information and does not constitute the provision of INVESTMENT ADVICE. Investors should, before acting on this information, consider the appropriateness of this information having regard to their personal objectives, financial situation or needs. We recommend investors obtain investment advice specific to their situation before making any financial investment decision.
 
FxGrow Daily Technical Analysis – 30th June, 2017
By FxGrow Research & Analysis Team

EUR/USD Still Invading 2016 Highs Ahead Of Local Data
EURUSD.png


EUR/USD, a shooting star through out the week, regaining 276-pips price action and 1.1145 high, both for yesterday and today so far. The pair is still boosted by Draghi's hawkish comments and yesterday's positive German CPI. Today, the pair awaits data both from EU and U.S which will give a better outlook how market will react by additional clawing on the rising trend or take a correction consolidation session, a break can be considered an easing before another bullish storm. On the other hand, U.S Index still prolongs cents losses with 2017 new low record at 95.20, giving room for EUR/USD to march forward.

Technically, the pair has surpassed the RSI 70 level (overbought) and the U.S Index touched RSI 30 level, closing to an ...

For more in depth Research & Analysis please visit FxGrow.https://goo.gl/zRpC61

Note: This analysis is intended to provide general information and does not constitute the provision of INVESTMENT ADVICE. Investors should, before acting on this information, consider the appropriateness of this information having regard to their personal objectives, financial situation or needs. We recommend investors obtain investment advice specific to their situation before making any financial investment decision.
 
FxGrow Daily Technical Analysis – 30th June, 2017
By FxGrow Research & Analysis Team

GBP/USD Technical Overview Ahead of UK & U.S Data
GBPUSD.png


GBP/USD extended the rising trend with +15-pips addition to yesterday's high 1.3015. The Cable is still boosted by positive recent fundamentals with Carney's hawkish tilts taking center stage. The pair awaits major data both from UK & U.S with expectations of high price action. Currently the pair is trading 1.2990 intraday.

Traders should expect a correction phase for GBP/USD taking into consideration that U.S Index RSI has ...

For more in depth Research & Analysis please visit FxGrow.

Note: This analysis is intended to provide general information and does not constitute the provision of INVESTMENT ADVICE. Investors should, before acting on this information, consider the appropriateness of this information having regard to their personal objectives, financial situation or needs. We recommend investors obtain investment advice specific to their situation before making any financial investment decision.
 
FxGrow Daily Technical Analysis – 30th June, 2017
By FxGrow Research & Analysis Team

Gold Remains Bearish Despite U.S Dollar Sharp Declines, Eyes On U.S Data
Gold.png


Gold showed a minor reaction yesterday to positive U.S GDP dropping to 1239.81 low and bouncing off, confused (Sideways) between 1247 and 1242, still the precious metal testing the 1240 area with rejection. On the other hand, with the sharp declines for greenback plunging today 95.20 low, yet gold fails to take advantage of pale U.S Index, refusing to advance as other currencies did yesterday.

Fundamentally, markets could be awaiting further data from U.S data to complete the key multi inflation figures with PCE and Personal Spending taking center stage. U.S Data today along with ...

For more in depth Research & Analysis please visit FxGrow.https://goo.gl/8J2pd3

Note: This analysis is intended to provide general information and does not constitute the provision of INVESTMENT ADVICE. Investors should, before acting on this information, consider the appropriateness of this information having regard to their personal objectives, financial situation or needs. We recommend investors obtain investment advice specific to their situation before making any financial investment decision.
 
FxGrow Daily Technical Analysis – 03rd July, 2017
By FxGrow Research & Analysis Team

EUR/USD Taking A break Before Further Advance, Eyes on Local Data
eurusd.png


After a superb run for EUR/USD last week with 1.1445 high with technical indicators shows an over bought market, the pair showed a daily bearish candle on Friday and extended the correction phase on Monday's trading session with 1.1403 low, On the other hand, U.S Index is currently showing a minor recovery with 95.55 high tackling EUR/USD from further advance. Currently the pair is trading 1.1408 intraday, still above 10-EMA at 1.1360.

Fundamentally, the pair awaits Manufacturing PMI, both from EU first, followed by U.S in after noon which should impact EUR/USD levels.


For more in depth Research & Analysis please visit FxGrow.https://goo.gl/UUfdM2

Note: This analysis is intended to provide general information and does not constitute the provision of INVESTMENT ADVICE. Investors should, before acting on this information, consider the appropriateness of this information having regard to their personal objectives, financial situation or needs. We recommend investors obtain investment advice specific to their situation before making any financial investment decision.
 
FxGrow Daily Technical Analysis – 04th July, 2017
By FxGrow Research & Analysis Team

GBP/USD Retesting Bullish Momentum Ahead of Construction PMI
GBPUSD.png


GBP/USD received a hit yesterday with negative with UK manufacturing PMI causing the cable 90-pips loss 1.2932 low. On the other hand, greenback extended recovery session today, boosted by positive data yesterday with a 96.04 high, add more pressure on the cable. Technically, the pair is still in uptrend phase trading above 10-EMA at 1.2880. GBP/USD is currently trading 1.2940 intraday.

Fundamentally, the pair awaits UK Construction PMI with absence of U.S Data today due to 4th of July holiday. The data will re-test GBP/USD bullish trend depending on the ...

For more in depth Research & Analysis please visit FxGrow.https://goo.gl/hR31Qf

Note: This analysis is intended to provide general information and does not constitute the provision of INVESTMENT ADVICE. Investors should, before acting on this information, consider the appropriateness of this information having regard to their personal objectives, financial situation or needs. We recommend investors obtain investment advice specific to their situation before making any financial investment decision.
 
FxGrow Daily Technical Analysis – 06th July, 2017
By FxGrow Research & Analysis Team

EUR/USD Still Testing 10-EMA Ahead of ECB Meeting
EURUSD.png


EUR/USD bullish momentum survived yesterday’s FOMC meeting as the U.S Index spikes were contaminated with 96.24 high as market expected more attacks due to previous hawkish U.S Fed statement, but instead a lesser was given by Yellen Yesterday.

The pair clocked 1.1368 high yesterday and 1.11325 low for today, still testing 10-EMA area at 1.1320 with 25-pips price action for today with expectations for more volatility as EU releases German Factory Orders, but the focus will be on ECB statement today.

Last appearances for Mr. Draghi were hawkish, stressing an intolerance for rising inflation in the EU and the ECB could taper with rates. ECB statement today, if it is consistent with Draghi’s last speeches, will fuel EUR/USD ...

For more in depth Research & Analysis please visit FxGrow.https://goo.gl/dGxzpC

Note: This analysis is intended to provide general information and does not constitute the provision of INVESTMENT ADVICE. Investors should, before acting on this information, consider the appropriateness of this information having regard to their personal objectives, financial situation or needs. We recommend investors obtain investment advice specific to their situation before making any financial investment decision.
 
FxGrow Daily Technical Analysis – 06th July, 2017
By FxGrow Research & Analysis Team

Crude Oil Recovers Over Disappointing API Report, Awaiting U.S Inventories
Crude.png


Crude oil plunged yesterday at $44.52 low after clocking a monthly high on Tuesday $47.30 bp. Reports (Reuters) showed that exports by OPEC counties has surged during pushing oil prices lower.

American Petroleum Institute (API) on Wednesday showed U.S. crude inventories fell more sharply than expected, down 5.8 million barrels in the week to June 30, against expectations for a draw of 2.3 million barrels (Reuters), pushing back oil levels at ...

For more in depth Research & Analysis please visit FxGrow.https://goo.gl/azMxF6

Note: This analysis is intended to provide general information and does not constitute the provision of INVESTMENT ADVICE. Investors should, before acting on this information, consider the appropriateness of this information having regard to their personal objectives, financial situation or needs. We recommend investors obtain investment advice specific to their situation before making any financial investment decision.
 
FxGrow Daily Technical Analysis – 07th July, 2017
By FxGrow Research & Analysis Team

Market Futures Technical Overview Ahead of Non-Farm Figure
NFP.jpg


Friday 7th July 2017, U.S is set to release major economic data. First, Unemployment Rate is doing far by good during the past years and it's highly expected to remain at 4.3% record. As for Average Hourly Earnings, last report booked 0.2% and expectations today are 0.3%. Any number between these two will be taken as a positive sign, but in case market was caught off guard with a lesser figure, this could be a game changer as Average Earnings, along with negative data released on June 4th.

As a result, NFP will take center stage today and expectations are at 175K and above, in case of a lesser number, then the buck will receive another punch pushing the U.S Index lower which could come in Trump's economic outlook favor.

SEP B-POUND

Current Price: 13000

Target: 13092

Resistance: 13040+, 13092

Support: 12930, 12891*

Trend Reversal Point: 1.2802

Trend: Upwards

Summary: The market remains in a short term bull advance with potential to attack the 13092 May high. A surge over Monday's high should fuel rallies near 13092. Be prepared for additional near term corrections, but narrow sideways congestion within the upper edges of last Wednesday's run over 12891*+ will keep bull forces. A close under 12891* is needed to stop the upturn and foster a correction down along 12802*.
SEP CANADIAN$

Currently: 77245

Target: None

Resistance: 7750?, 8000

Support: 7688, 7661, 76435*

Trend Reversal: 75.985

Trend: Up

Comment The market is bullish. A close over 7727 could fuel aggressive rallies towards 8000. A reluctance to extend past Wednesday's high today will caution for near term corrections into next week. A close under 76435* warns for a correction phase back through last week's run.

SEP EURO

For more in depth Research & Analysis please visit FxGrow.https://goo.gl/XyUJcH

Note: This analysis is intended to provide general information and does not constitute the provision of INVESTMENT ADVICE. Investors should, before acting on this information, consider the appropriateness of this information having regard to their personal objectives, financial situation or needs. We recommend investors obtain investment advice specific to their situation before making any financial investment decision.
 
FxGrow Daily Technical Analysis – 11th July, 2017
By FxGrow Research & Analysis Team

EUR/USD In Search For Positive Fundamental To Press Forward
EURUSD.png


EUR/USD has entered the second consolidation session this week with 1.1381 low and 1.1418 high yesterday, so far the pair traded 18-pips today, with expectations to stay within yesterdays trading range. Currently the pair is trading 1.1395 intraday with daily RSI at 60 level and hourly RSI at 50 level, which gives EUR/USD the chance to score stingy pips aimed at 1.1420, 1.1445 resistance levels. On the other hand, the greenback remains bearish and Index failed to close above 96.54 for trend reversal, which keeps EUR/USD hanging above, ready to press forward.

Fundamentally, the pair showed no reaction to today's and yesterday's positive EU data, which indicates that EUR/USD is in search for ...

For more in depth Research & Analysis please visit FxGrow.https://goo.gl/JPXkBR

Note: This analysis is intended to provide general information and does not constitute the provision of INVESTMENT ADVICE. Investors should, before acting on this information, consider the appropriateness of this information having regard to their personal objectives, financial situation or needs. We recommend investors obtain investment advice specific to their situation before making any financial investment decision.
 
FxGrow Daily Technical Analysis – 11th July, 2017
By FxGrow Research & Analysis Team

AUD/USD Loses The Bullish Momentum, Favoring Sideways
AUDUSD.png


AUD/USD failed to sustain the bullish momentum today as it f 0.7626 high, retreating low of 0.7605 during the European trading session. Currently the pair is trading at 0.7608 intraday just above its 100-EMA at 0.7605.

Fundamentally, the National Australia Bank (NAB) Business Confidence Index was neutral recording 9 compared to 8 on previous sessions, but the negative Home Loans data added more pressure over the Aussie. Traders should be aware of the Chinese Trade balance, to be ...

For more in depth Research & Analysis please visit FxGrow.https://goo.gl/W2xm7p

Note: This analysis is intended to provide general information and does not constitute the provision of INVESTMENT ADVICE. Investors should, before acting on this information, consider the appropriateness of this information having regard to their personal objectives, financial situation or needs. We recommend investors obtain investment advice specific to their situation before making any financial investment decision.
 
FxGrow Daily Technical Analysis – 12th July, 2017
By FxGrow Research & Analysis Team

GBP/USD Testing 50-EMA Ahead of Major Data
GBPUSD.png


GBP/USD extended the selloff wave since yesterday with 113-pips value loss, landing in 1.2810 low for now. The pair tested daily 50-EMA at 1.2820 with failure and in case market closing below, signs of bearish momentum will persist.

MPC member Broadbent crossed wires yesterday with a dovish stance hinting for many current obstacles facing UK economic outlook, being inconsistent with Carney's recent hawkish speech, hence a negative wave still evolves for the cable.

Fundamentally, the pair awaits major inflation reports shortly with two possible scenarios. A negative data will add more ...


For more in depth Research & Analysis please visit FxGrow.https://goo.gl/4X7Roo

Note: This analysis is intended to provide general information and does not constitute the provision of INVESTMENT ADVICE. Investors should, before acting on this information, consider the appropriateness of this information having regard to their personal objectives, financial situation or needs. We recommend investors obtain investment advice specific to their situation before making any financial investment decision.
 
FxGrow Daily Technical Analysis – 12th July, 2017
By FxGrow Research & Analysis Team

Crude Oil Inches Higher Over EIA Report, Awaiting U.S Inventories
Crude.png


Crude Oil managed to add $2.36 bp since Monday and clocked $45.99 bp high supported by the U.S. Energy Information Administration report on Tuesday as it expects U.S. crude oil production to rise by less than previously forecast next year due to a lower price outlook, but remaining at record. Also, reports by Reuters mentioned that Saudi Arabia is due to decrease their oil exports to the lowest record during August.

On the other hand, other fundamentals such as Libya and Nigeria (Non-OPEC) extended their oil production output, keeps market overloaded (glut) and oil rising prices at slower pace.

Add to that, Iran's oil output will rise to ...

Yesterday, Qatar signed a contract with Total French Company to develop Shahine field with $3.5B and could see oil production at 300,000 bp day.

For more in depth Research & Analysis please visit FxGrow.https://goo.gl/CJQub4

Note: This analysis is intended to provide general information and does not constitute the provision of INVESTMENT ADVICE. Investors should, before acting on this information, consider the appropriateness of this information having regard to their personal objectives, financial situation or needs. We recommend investors obtain investment advice specific to their situation before making any financial investment decision.
 
FxGrow Daily Technical Analysis – 12th July, 2017
By FxGrow Research & Analysis Team

USD/CAD Trading On An Expired BOC's Decision, Eyes on Poloz
USDCAD.png


USD/CAD was on a heavy selloff wave ever since Gov. Poloz (June 28) hinted for a possible tapering with an increase by BOC interest rates by 0.25% to current 0.50%. Overall, the pair has lost 340-pips price action on Friday with 1.2859 low and daily RSI around 25 level, which indicates an oversold market with potential for correction phase in case USD/CAD wants to continue pressing downward.

The pair started the correction phase since Monday with 1.2943 high yesterday, but current daily RSI is at 32 level which still indicates an oversold market.

Today, expectations that BOC will deliver the rate ...

For more in depth Research & Analysis please visit FxGrow.https://goo.gl/zZx3FE

Note: This analysis is intended to provide general information and does not constitute the provision of INVESTMENT ADVICE. Investors should, before acting on this information, consider the appropriateness of this information having regard to their personal objectives, financial situation or needs. We recommend investors obtain investment advice specific to their situation before making any financial investment decision.
 
FxGrow Daily Technical Analysis – 13th July, 2017
By FxGrow Research & Analysis Team

EUR/USD Surges Higher Ahead of Local CPI Data
EURUSD.png


EUR/USD inaugurated Asian trading sessions with +30-pips price action and clocked 1.1439 high as the greenback extends downtrend for today at 95.34 low. Yesterday, Yellen crossed and failed to give specifics as questions were addressed which left market confused and the DXY couldn't press forward and traded neutrally.

Today, multi data on both EURO and USD which should shake the pair's movement, first German and French CPI shortly, followed on NY opening sessions with ...

For more in depth Research & Analysis please visit FxGrow.https://goo.gl/R1XPb9

Note: This analysis is intended to provide general information and does not constitute the provision of INVESTMENT ADVICE. Investors should, before acting on this information, consider the appropriateness of this information having regard to their personal objectives, financial situation or needs. We recommend investors obtain investment advice specific to their situation before making any financial investment decision.
 
FxGrow Daily Technical Analysis – 13th July, 2017
By FxGrow Research & Analysis Team

Gold Remains Bearish Despite Recent Recovery, Eyes on U.S Data
Gold.png


Gold plunged aggressively on Monday at 1204.90 on Monday sending a strong message that further downside yet prevails, but managed to make a correction phase extended till Thursday before clocking a 1225.15 yesterday sending signs of a potential bullish reversing trend. Current phase for gold should be a correction phase that holds potential for an uptrend, but unless gold closes above 1228 by daily chart or at least 4 hours candle stick, market should be prepared for an another aggressive selloff wave extended towards 1195+, with potential for 1190+.

Fundamentally, Yellen speech yesterday kept the U.S Index on high volatility which had its effect on Gold, and today, Yellen, along with U.S Data which will be released shortly will give a better outlook how market will react towards gold. In case gold broke closed closed below 1213, additional confirmation for further selloff waves, and in case gold failed to close above 1228, then trend will be sideways until further notice.

For more in depth Research & Analysis please visit FxGrow.https://goo.gl/Ngt6fZ

Note: This analysis is intended to provide general information and does not constitute the provision of INVESTMENT ADVICE. Investors should, before acting on this information, consider the appropriateness of this information having regard to their personal objectives, financial situation or needs. We recommend investors obtain investment advice specific to their situation before making any financial investment decision.
 
FxGrow Daily Technical Analysis – 14th July, 2017
By FxGrow Research & Analysis Team

Futures Technical Overview Ahead of U.S Data Release

U.S is set to release multi inflation figure with CPI and Core CPI in focus. Yesterday, market reaction to Yellen speech was mostly neutral, but what make today's data vital is that Yellen couldn't deliver clear signs about two main issues driving the market. First coming rate hikes and U.S Federal balance sheet. Both, will be subject to economic cycle performance and data should be watched in case the U.S Fed could take a decision regarding them.

Hence, today's data will be watched closely by markets and based on results, traders will take action with expectation for high volatility than the previous days. The main focus will be on CPI and Core CPI as they have more impact on the interest rates in case a decision to be taken.

The Fed chair is not speaking Friday, but Yellen's surprising comments on inflation in congressional testimony this week make Friday's CPI an even hotter topic for markets than it normally would be. CPI is expected to rise by a slight 0.1 percent on headline inflation. (CNBC).

Technical levels for future currencies:
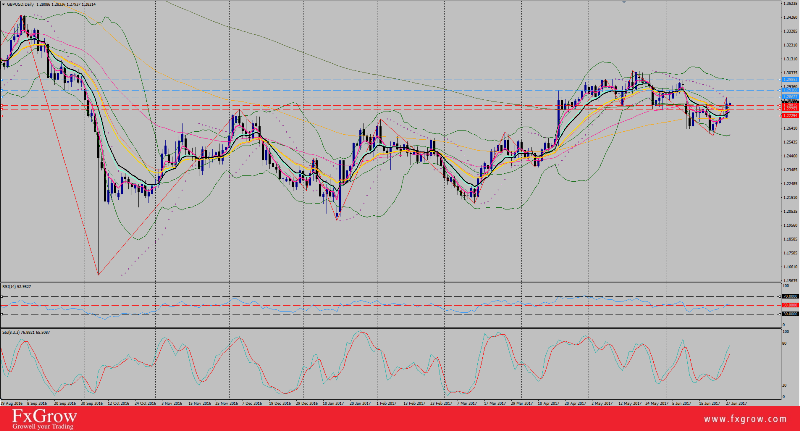
SEP B-POUND

Currently: 12971

Target: None

Resistance: 12977*, 13047+ 12933,

Support: 12894-90, 12849

Trend: Sdwys/Up

Trend Reversal: 1.2802

Comment The market remains short term bullish and yesterday's rally alerts for a preliminary upturn from recent corrections. Trade is poised to launch secondary rallies and a close over 12977* will spark a run to attack over the 13092 high. Any further dips should hold over Wednesday's low to keep a bull alignment. A drop under 12839 targets a drop to 12802* support.

SEP EURO

Currently: 114435

Target: 11580

Resistance: 11490, 11515+, 11580

Support: 11413-12, 11391*

Trend: Up

Trend Reversal: 113.085

Comment The market is bullish, still signaling for a run to 11580+. A pop over Wednesday's reversal high will spark the extension to 11580. Be prepared for additional near term corrective action today, but only a close under 11391* marks a near term peak and signals for retracements to attack 113085* for a larger downturn.

SEP J-YEN

Currently: 88545

Target: None

Resistance: 8879-8885, 8959*

Support: 8838, 8805, 8760-

Trend: Down

Trend Reversal: 8959

Comment: Overall the market is short term bearish. A roll off back through 8800- is negative. A close under the 8760 May low alerts for a larger bear wave near 8700. Wednesday's corrective action hints for near rebounds. A push over 8885 will boost rallies. A close over 8959* is needed to trigger a reversing turn and we should suspect a setback from 8959* on the first test.
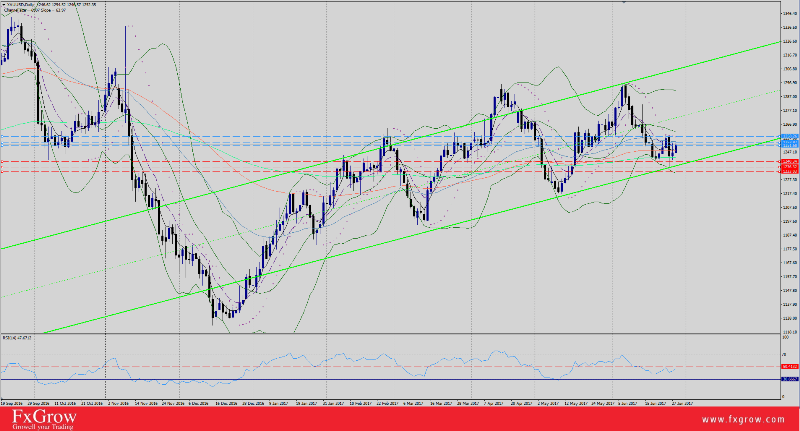
SEP SWISS

Currently (10381)

Target: None

Resistance: 10411, 10444-57*,

Support: 10483 10380*-, 10326-

Trend: Sdwys

Trend Reversal Point: 103.80

Comment The market is still bullish and climb over last week's 10483 high or close over 10457* are needed to recapture bull forces and renew the projection to 10700+. However, note yesterday's close is against 10380* support which must hold to maintain bull trend forces. A close under 10380* is bearish, alerting for a selling wave under 10300-.

SEP US DOLLAR

Currently: (95508)

Target: 9507

Resistance: 95915, 9614, 96645*

Support: 9530-, 9507

Trend: Down

Trend Reversal: 96.645

Comment The market is bearish, still suggesting selloffs to reach for 9507. Last week's flagging action leaves trade ready to initiate the flagging downturn. A close under 9507 could add washouts to 9450-9400. Minor recovery action trapped inside this week's range will maintain bear forces. A rebound over 9596 is near term positive, but only a close over 96645* signals a lasting turn to higher prices.

SEP AUSSIE$

Currently: (7725)

Target: 7818

Resistance: 7818

Support:7699, 7685, 7668*

Trend: Up

Trend Reversal: 7627

Comment Yesterday's rally highlights a significant upside breakout and opens up potential for rallies to 7818. Trade is poised for aggressive rallies. Any corrective dips that hold within yesterday's range will maintain strong bull forces and create a staging level for rallies. Only a close under 7668* warns for a multi-day correction phase back down to 7627*.
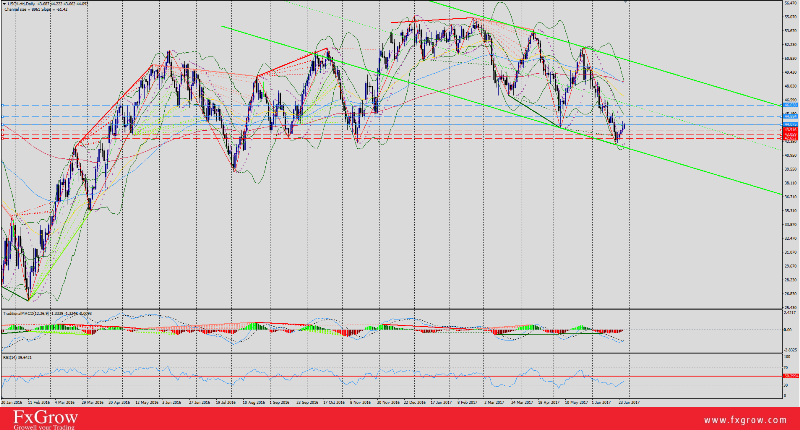
AUG GOLD

Currently 121640

Target: 118920

Resistance: 122350-122420, 122830*

Support: 121460-00, 1208-, 119940

Trend: Down

Trend Reversal: 1238.60

Comment The market remains in a downturn and holds potential below 1200-. A flagging downturn from current corrections calls for aggressive selloffs. Near term corrections that stall in the 1220's will reinforce the bear pattern. A close over 122830* is needed to stop the downturn and send rallies to 123860*.


For more in depth Research & Analysis please visit FxGrow.https://goo.gl/9a4k9k

Note: This analysis is intended to provide general information and does not constitute the provision of INVESTMENT ADVICE. Investors should, before acting on this information, consider the appropriateness of this information having regard to their personal objectives, financial situation or needs. We recommend investors obtain investment advice specific to their situation before making any financial investment decision.
 
FxGrow Daily Technical Analysis – 17th July, 2017
By FxGrow Research & Analysis Team

EUR/USD Pushes Higher As The Buck Reaches Lower, CPI Eyed

EUR/USD bullish trend is sustained supported by U.S Negative released on Friday, with disappointing CPI as Yellen mentioned that any tapering with Rates and U.S Federal balance sheet will be subject to economic data (U.S Data on Friday). As a result, the pair rallied from 1.1391 low on Friday, extended weaker gains this week with a higher high by 5-pips and 1.1475 peak for today.
Currently, the pair is trading 1.1448, awaiting vital data as EU releases Final CPI y/y. ECB will release a statement this Thursday along with Interest Rates decision which makes today's data articular. Draghi has mentioned for a potential change or increasing rates, if not, Quantitative Easing program edition which is currently attracting EUR/USD fever buyers, hence the pair dwelling high above. As for the buck, the U.S Index looks helpless with a yearly low at 94.83 for today.

Fundamentals:

1- EUR - Findal CPI and Core CPI today at 9:00 AM GMT.

Technical Overview:

Trend: Up

Target: 1.1580

Resistance levels: R1 1.1485+ , R2 1.1528, R3 1.1560+/- (D1)

Support levels: S1 1.1459, S2 1.1440, S3 1.1391 (D1)

Comment EUR Future: The market is bullish, still signalling for a run to 1.1580+. A pop over last week's reversal high will spark the extension to 1.1580. Be prepared for additional near term corrective action along 1.1450 to continue developing a staging level for rallies. Only a close under 1.1391* marks a near term peak and signals for retracement to attack 1.1308* for a larger downturn.

Daily RSI is at 62 , Hourly RSI at 51, which gives the pair space to push higher than Friday's high.

For more in depth Research & Analysis please visit FxGrow.https://goo.gl/9a4k9k

Note: This analysis is intended to provide general information and does not constitute the provision of INVESTMENT ADVICE. Investors should, before acting on this information, consider the appropriateness of this information having regard to their personal objectives, financial situation or needs. We recommend investors obtain investment advice specific to their situation before making any financial investment decision.
 
Top