USDJPY Price Action Signals More Weakness
USD/JPY, the US Dollar against the Japanese Yen, is one of the most important major forex pairs and is often nicknamed the Gopher. In today’s USD/JPY fundamental analysis, Japan’s Trade Statistics may be the more direct catalyst, as a stronger trade balance could support the yen and limit upside, while the US EIA crude inventories report is more likely to affect the pair indirectly through oil prices, sentiment, and broader US dollar movement.

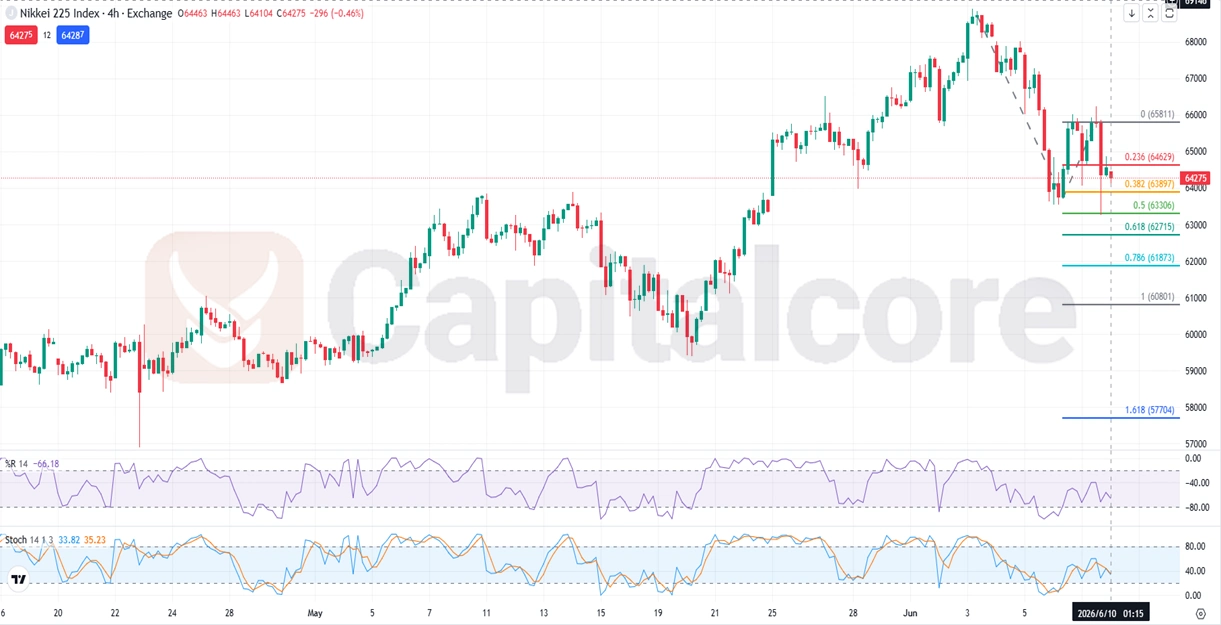
Chart Notes:
• Chart time-zone is UTC (+03:00)
• Candles’ time-frame is 4h
On the USD/JPY H4 chart, after hitting 160.336, price started to move lower inside a gentle bearish channel, and although it later formed a higher low, that major peak still keeps USD/JPY price action exposed to further downside. Bollinger Bands 20 suggest volatility may narrow after price touched the upper band, Stochastic 14 1 3 at 86.30 and 90.63 signals overbought conditions, and RSI 14 at 58.15 shows some recovery strength but not enough to cancel the bearish H4 structure, so while the pair stays below channel resistance and under 160.336, the technical outlook still favors bearish continuation toward lower support levels.
•DISCLAIMER: Please note that the above analysis is not an investment suggestion by “Capitalcore LLC”. This post has been published only for educational purposes.
Capitalcore
USD/JPY, the US Dollar against the Japanese Yen, is one of the most important major forex pairs and is often nicknamed the Gopher. In today’s USD/JPY fundamental analysis, Japan’s Trade Statistics may be the more direct catalyst, as a stronger trade balance could support the yen and limit upside, while the US EIA crude inventories report is more likely to affect the pair indirectly through oil prices, sentiment, and broader US dollar movement.
Chart Notes:
• Chart time-zone is UTC (+03:00)
• Candles’ time-frame is 4h
On the USD/JPY H4 chart, after hitting 160.336, price started to move lower inside a gentle bearish channel, and although it later formed a higher low, that major peak still keeps USD/JPY price action exposed to further downside. Bollinger Bands 20 suggest volatility may narrow after price touched the upper band, Stochastic 14 1 3 at 86.30 and 90.63 signals overbought conditions, and RSI 14 at 58.15 shows some recovery strength but not enough to cancel the bearish H4 structure, so while the pair stays below channel resistance and under 160.336, the technical outlook still favors bearish continuation toward lower support levels.
•DISCLAIMER: Please note that the above analysis is not an investment suggestion by “Capitalcore LLC”. This post has been published only for educational purposes.
Capitalcore