Gold Price Rallies While Crude Oil Price Takes Hit

Gold price started a fresh increase above the $1,750 resistance zone. Crude oil price is sliding and remains at a risk of more losses below $90.
Important Takeaways for Gold and Oil
Gold Price Technical Analysis
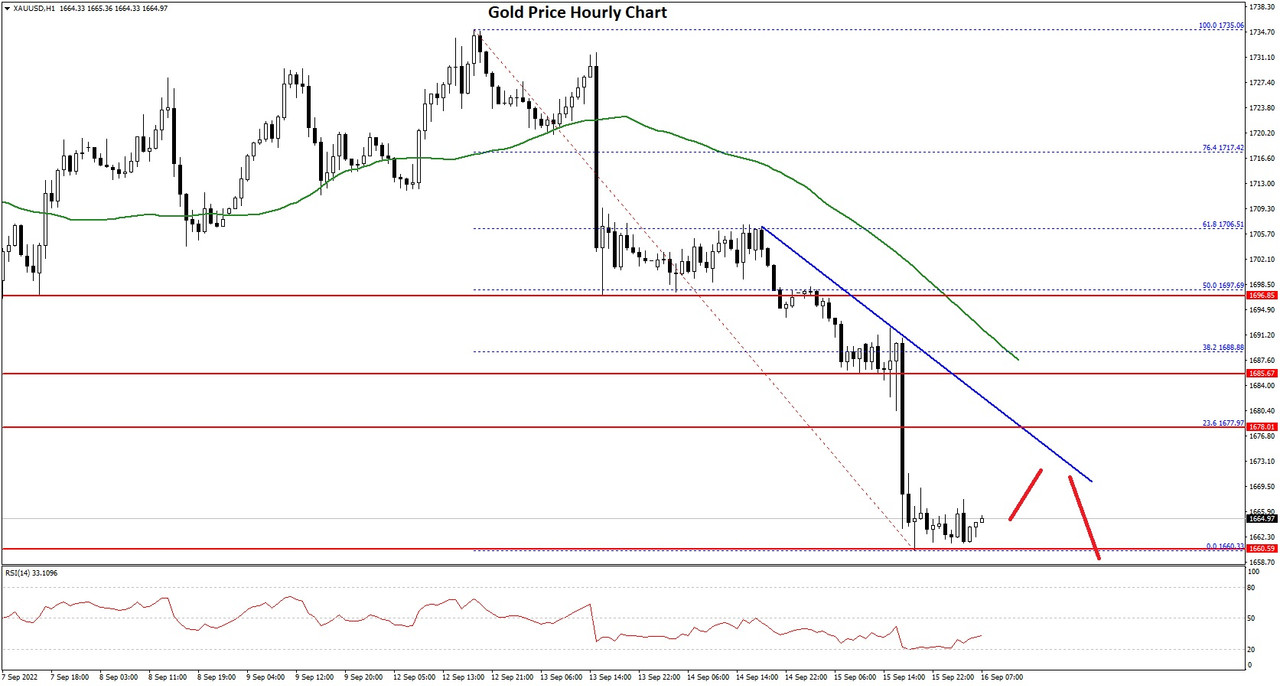
Gold price formed a base above the $1,700 level and started a fresh increase against the US Dollar. The price broke the $1,720 resistance to move into a positive zone.
There was a clear move above the $1,750 resistance and the 50 hourly simple moving average. Besides, there was a break above a key bearish trend line with resistance near $1,762 on the hourly chart of gold.
The price traded as high as $1,794 on FXOpen and the price is now consolidating gains. An immediate support on the downside is near the $1,788 level.
The price even traded below the $1,700 level and formed a low near $1,680 on FXOpen. It is now correcting losses above the $1,695 level. On the downside, an initial support is near the $1,785 level. It is near the 23.6% Fib retracement level of the upward move from the $1,754 swing low to $1,794 high.
The next major support is near the $1,774 level or the 50% Fib retracement level of the upward move from the $1,754 swing low to $1,794 high, below which there is a risk of a larger decline. In the stated case, the price could decline sharply towards the $1,750 support zone.
On the upside, the price is facing resistance near the $1,795 level. A clear upside break above the $1,795 resistance could send the price towards $1,812. The main resistance is now forming near the $1,820 level. A close above the $1,820 level could open the doors for a steady increase towards $1,840.
VIEW FULL ANALYSIS VISIT - FXOpen Blog
Gold price started a fresh increase above the $1,750 resistance zone. Crude oil price is sliding and remains at a risk of more losses below $90.
Important Takeaways for Gold and Oil
- Gold price gained pace after it cleared the $1,750 resistance against the US Dollar.
- Recently, there was a break above a key bearish trend line with resistance near $1,762 on the hourly chart of gold.
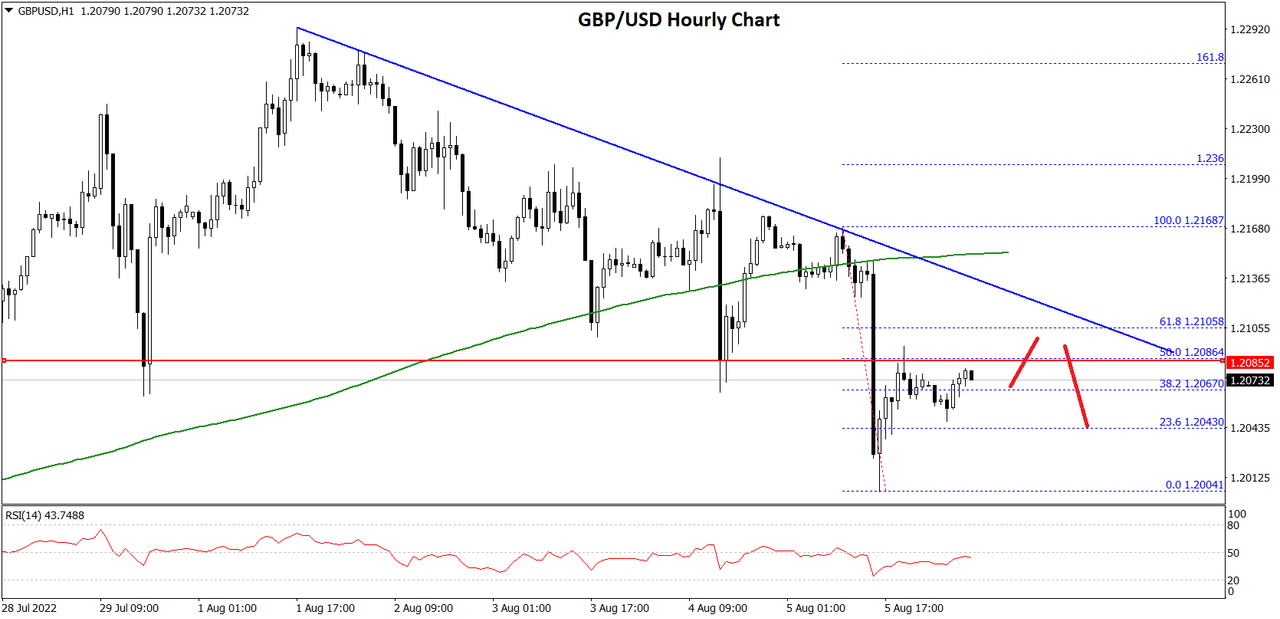
- Crude oil price started a fresh decline from the $96.00 and $96.50 resistance levels.
- There is a crucial bearish trend line forming with resistance near $91.20 on the hourly chart of XTI/USD.
Gold Price Technical Analysis
Gold price formed a base above the $1,700 level and started a fresh increase against the US Dollar. The price broke the $1,720 resistance to move into a positive zone.
There was a clear move above the $1,750 resistance and the 50 hourly simple moving average. Besides, there was a break above a key bearish trend line with resistance near $1,762 on the hourly chart of gold.
The price traded as high as $1,794 on FXOpen and the price is now consolidating gains. An immediate support on the downside is near the $1,788 level.
The price even traded below the $1,700 level and formed a low near $1,680 on FXOpen. It is now correcting losses above the $1,695 level. On the downside, an initial support is near the $1,785 level. It is near the 23.6% Fib retracement level of the upward move from the $1,754 swing low to $1,794 high.
The next major support is near the $1,774 level or the 50% Fib retracement level of the upward move from the $1,754 swing low to $1,794 high, below which there is a risk of a larger decline. In the stated case, the price could decline sharply towards the $1,750 support zone.
On the upside, the price is facing resistance near the $1,795 level. A clear upside break above the $1,795 resistance could send the price towards $1,812. The main resistance is now forming near the $1,820 level. A close above the $1,820 level could open the doors for a steady increase towards $1,840.
VIEW FULL ANALYSIS VISIT - FXOpen Blog