One of the most challenging tasks when trading is price forecasting, this meaning not only calling for turning points (tops or bottoms), but also for the time the specific forecast is going to happen.
Trading without taking into account the time element is a deadly mistake and should be avoided by traders at all costs. Knowing a certain price will be touched but not having any idea about when such thing will happen, it should be viewed like a job half done.
There are several trading theories that tried to incorporate the time element into any ones trading decision, but none come so close to reality like the Elliott Waves Theory and the works of W.D.Gann.
In the case of Elliott, for specific patterns/waves price makes, time can/should be considered when trying to count waves. For example, if price is developing a wedge, falling or rising, and this one comes as an ending diagonal, then it is typical for price to reach the fifty percent retracement from the whole wedge in less than the time taken for the whole wedge to form. And there you go you have a target, namely the price value given by the retracement level, and the possible time for that target to be reached.
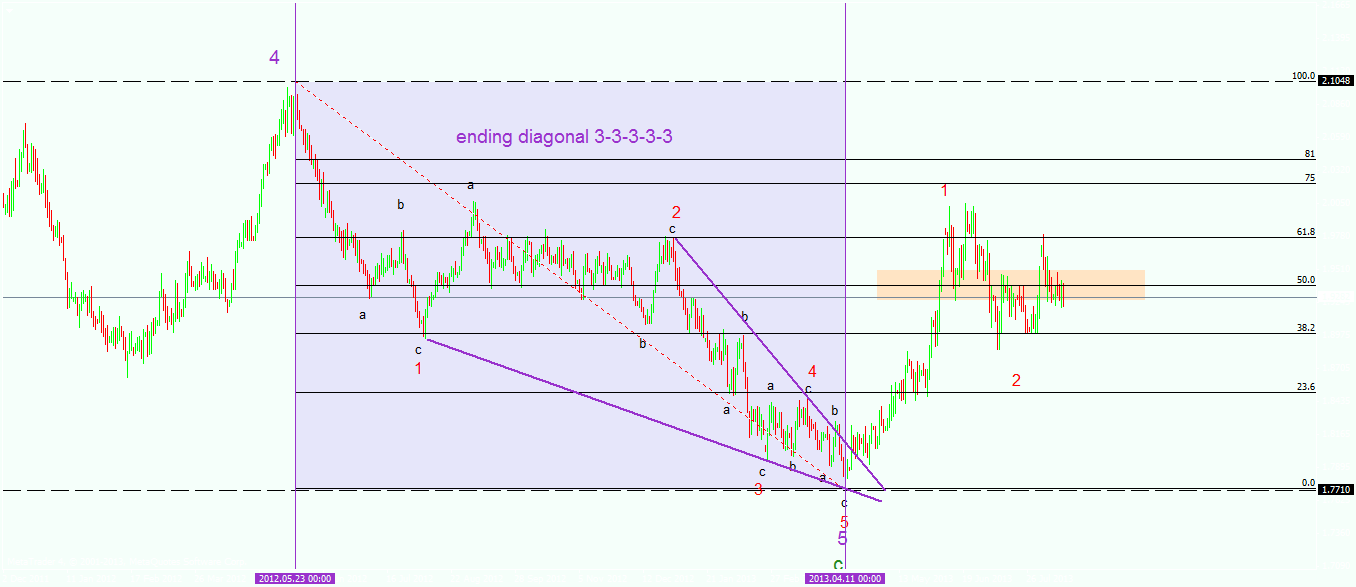
Such examples are frequent under the Elliott Waves Theory and they do show that time can be incorporated in any market analysis. However, even with Elliot, the whole notion is relative as it does not allows a trader to exactly call for the moment of time a specific price will be reached. What it does show is a way to use time when looking at different waves price is making, but to actually forecast the time and the price one needs something more to add to the analysis.
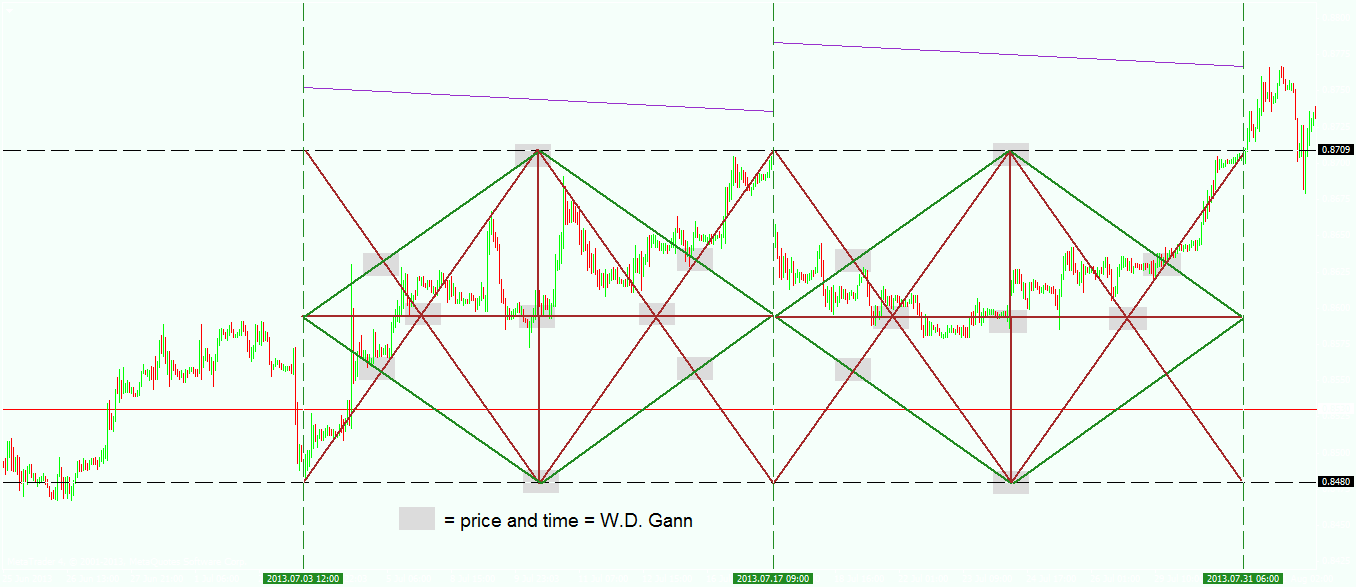
One of the biggest contributors to the technical analysis field was W.D.Gann, and he dedicated a big part of his analysis trying to find the time a specific security/financial product will reach a certain level, and in order to do that, according to Gann, the time element should have the same importance. For this, one needs to use the vertical (time), the horizontal (price) and the diagonal (time taken for price to reach a specific level).
According to Gann each security/financial instrument, etc., has its own way of moving and therefore a specific angle that product uses every time it moves. This is called the 1×1 line and represents the Holy Grail in trading, in the sense that one of the most important things to look for when looking at a financial product is this 1×1 line, or the line that gives the angle of the move. However, in time it has been discovered that the angle in an upside move is different than the angle in a downside move, and this is because complacency in the first place, and panic in the second, come. Because of that there should be a 1×1 line for any move to the upside a security/financial product makes, and another 1×1 line for any move to the downside.
Interesting to note is the fact that the downside angle is steeper than the upside one, and that is attributed to human behavior coming and influence market moves. Factors like panic, complacency, greed and fear are different in nature, hence the different angles for the 1×1 line should be considered.
As you can see in the chart above, confluence areas are being drawn based on the time taken for the first square to form and the result is projected on the right side, looking for similarities between the two.
In conclusion, regardless what strategy/theory/system you are working/trading with, taking time into consideration should be a top priority in any analysis. This has been a challenge for many generations of traders, but the quest of knowing the exact PRICE AND TIME is still on.
This article is a contribution by John from Forex Brokers Hub
Speak Your Mind